Breakpoints
Breakpoints are special markers that suspend program execution at a specific point. This lets you examine the program state and behavior. Breakpoints can be simple, for example, suspending the program on reaching some line of code, or involve more complex logic, such as checking against additional conditions, writing to a log, and so on).
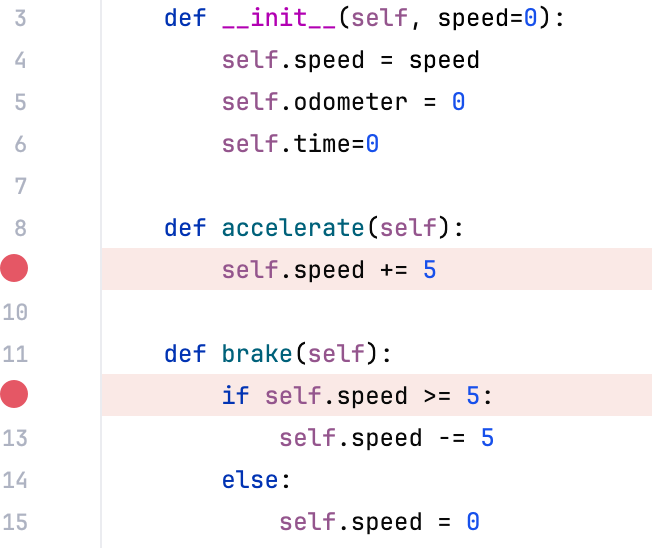
Once set, a breakpoint remains in your project until you remove it explicitly, except for temporary breakpoints.
note
If a file with breakpoints was modified externally, for example, updated through a VCS or changed in an external editor, and the line numbers have changed, breakpoints will be moved accordingly. Note that PyCharm must be running when such changes are made, otherwise they will pass unnoticed.
The following types of breakpoints are available in PyCharm:
Line breakpoints: suspend the program upon reaching the line of code where the breakpoint was set. This type of breakpoints can be set on any executable line of code.
Exception breakpoints: suspend the program when
Exceptionor its subclasses are thrown. In PyCharm, you can set breakpoints for Python exceptions. For PyCharm Pro, Django, Jinja2, JavaScript, and Jupyter exception breakpoints are available. They apply globally to the exception condition and do not require a particular source code reference. Unlike stack traces, suspending an application on an exception allows you to examine the surrounding context or data while it is still available.
Click the gutter at the executable line of code where you want to set the breakpoint. Alternatively, place the caret at the line and press CtrlF8.

Press CtrlShiftF8 or select Run | View Breakpoints from the main menu.
In the Breakpoints dialog, press AltInsert or click
, and select Python Exception Breakpoint or JavaScript Exception Breakpoint.
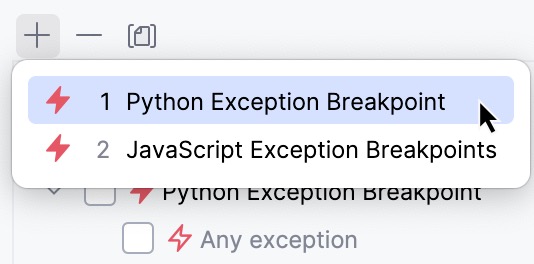
For non-exception breakpoints the breakpoint in the gutter.
For all breakpoints: go to Run | View Breakpoints CtrlShiftF8 in the main menu, select the breakpoint, and click
Remove or press Delete.
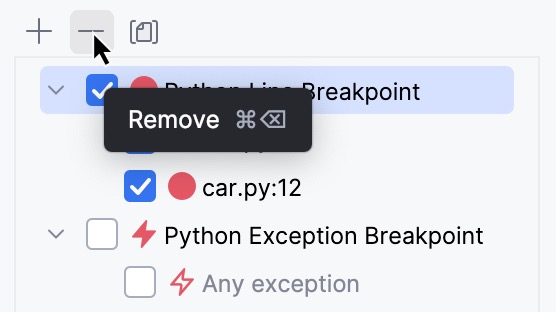
To avoid accidentally removing a breakpoint and losing its parameters, you can choose to remove breakpoints by dragging them to the editor or clicking the middle mouse button. To do this, go to Settings | Build, Execution, Deployment | Debugger and select Drag to the editor or click with middle mouse button. Clicking a breakpoint will then enable or disable it.
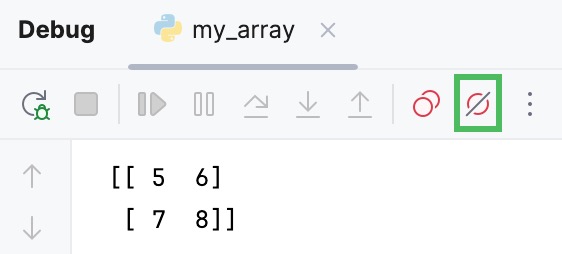
If you don't need to stop at your breakpoints for some time, you can mute them. This allows you to resume normal program operation without leaving the debugger session. After that, you can unmute breakpoints and continue debugging.
Click the Mute Breakpoints button
in the toolbar of the Debug tool window.
When you remove a breakpoint, its internal configuration is lost. To temporarily turn an individual breakpoint off without losing its parameters, you can disable it:
For non-exception breakpoints: right-click it and set the Enabled option as required. You can also toggle them with the middle mouse button if removing breakpoints is not assigned to it.

For all breakpoints: click Run | View Breakpoints CtrlShiftF8 and check/uncheck the breakpoint on the list.
To move a breakpoint, drag it to another line.
To copy a breakpoint, hold Ctrl and drag a breakpoint to another line. This creates a breakpoint with the same parameters at the destination.
You can view the list of all breakpoints in the Bookmarks tool window. Breakpoints are automatically added to the dedicated list in the tool window once you place them in your code.
In the main menu, go to View | Tool Windows | Bookmarks or press Alt02 and expand the Breakpoints list.
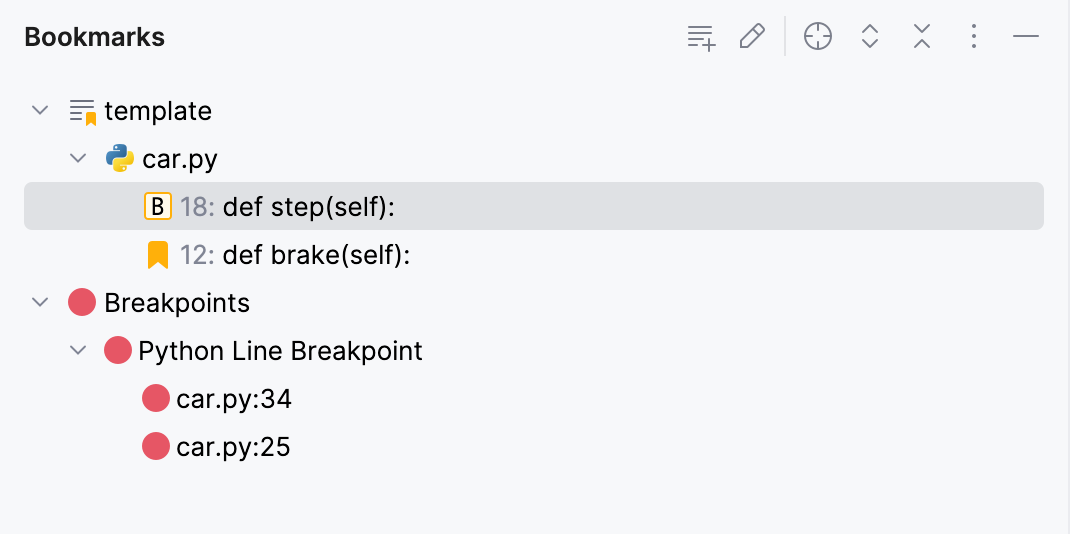
You can organize breakpoints into groups, for example, if you need to mark out breakpoints for a specific problem.
In the Breakpoints dialog CtrlShiftF8, select a breakpoint you want to place in a group and select Move to group from the menu.

Depending on the breakpoint type, you can configure additional properties which allow you to tailor its operation for specific needs. The most used options are available via intentions.
To access breakpoint intentions, place the caret at the line with the breakpoint and press AltEnter. Use this option when you need to quickly configure basic breakpoint properties.
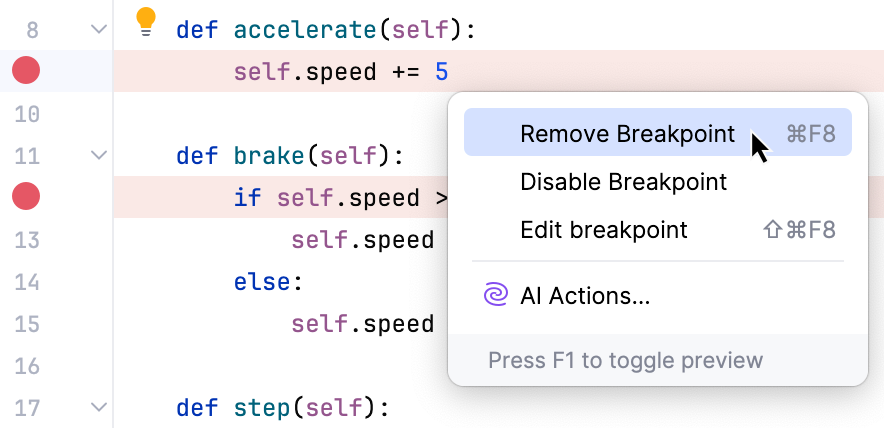
To access the full list of properties, right-click the breakpoint and click More or press CtrlShiftF8.
Intention | Description |
|---|---|
Remove breakpoint | Removes the breakpoint at the selected line. |
Disable Breakpoint | Disables the breakpoint at the selected line. |
Edit Breakpoint | Opens a dialog with the most used breakpoint properties. For more properties, click More or press CtrlShiftF8. |
Option | Description | Breakpoint type |
|---|---|---|
Enabled | Clear the checkbox to temporarily disable a breakpoint without removing it from the project. Disabled breakpoints will be skipped during the debugging process. | All types |
Suspend | Select the checkbox to pause the program execution when a breakpoint is hit. Suspending an application is useful if you need to obtain logging information or calculate an expression at a certain point without interrupting the program. If you need to create a master breakpoint that will trigger dependent breakpoints when hit, choose not to suspend the program at that breakpoint. Choose the suspend policy:
| All types |
Condition | Select to specify a condition for hitting a breakpoint. A condition is a Python Boolean expression. This expression must be valid at the line where the breakpoint is set, and it is evaluated each time the breakpoint is hit. If the evaluation result is | Python Line and Exception breakpoints |
Log | Select if you want to log the following events to the console:
| Python Line and Exception breakpoints |
Evaluate and log | Select to evaluate an expression when the breakpoint is hit, and show the result in the console output. | Python Line and Exception breakpoints |
Remove once hit | Select to remove the breakpoint from your project right after it has been hit. | Django Exception, Jinja2 Exception, and JavaScript Exception breakpoints |
Disable until breakpoint is hit | Select the breakpoint that will trigger the current breakpoint. Until that breakpoint is hit, the current breakpoint will be disabled. You can also select if you wish to disable it again or leave it enabled once it has been hit. | All types |
Uncaught only | Select to be notified when you've hit a breakpoint on an uncaught exception. | JavaScript Exception breakpoints |
Activation policy | ||
On termination | Select to stop the debugger when the process terminates on throwing this exception. | Python Exception breakpoints |
On raise | Select to stop the debugger on throwing this exception. In this case the process doesn't terminate. | Python Exception breakpoints |
Ignore library files | Select if you do not want the debugger to stop if this exceptions is thrown inside a library. | Python Exception breakpoints |
Breakpoints can have the following statuses:
Status | Description |
|---|---|
Verified | After you have started a debugger session, the debugger checks whether it is technically possible to suspend the program at the breakpoint. If yes, the debugger marks the breakpoint as verified. |
Warning | If it is technically possible to suspend the program at the breakpoint, however there are issues related to it, the debugger sets the breakpoint status to warning. This may happen, for example, when it is impossible to suspend the program at one of the method's implementations. |
Invalid | If it is technically impossible to suspend the program at the breakpoint, the debugger marks it as invalid. This often happens because there is no executable code on the line. |
Inactive/dependent | A breakpoint is marked as inactive/dependent when it is configured to be disabled until another breakpoint is hit, and this has not happened yet. |
Muted | All breakpoints are temporarily inactive because they have been muted. |
Disabled | This breakpoint is temporarily inactive because it has been disabled. |
Non-suspending | The suspend policy is set for this breakpoint so that it does not suspend the execution when hit. |
Depending on their type and status, breakpoints are marked with the following icons:
Line | Exception | |||
|---|---|---|---|---|
Regular | ||||
Disabled | ||||
Verified | ||||
Muted | ||||
Inactive/dependent | ||||
Muted disabled | ||||
Non-suspending | ||||
Verified non-suspending | ||||
Invalid | ||||
note
The provided icons correspond to the standard IDE themes. Custom themes may use different icons.
- Use breakpoints for debug printing
Use non-suspending logging breakpoints (sometimes referred to as watchpoints in other debuggers) instead of inserting print statements in your code. This provides a more flexible and centralized way of handling debug log messages.
- Set logging breakpoints more quickly
To set a non-suspending logging breakpoint, hold Shift and click the gutter. This will not suspend the program execution and instead log a message like
Breakpoint reached: threads.py:28. If you want to log some expression that is in front of you in the editor, select it before holding Shift and clicking the gutter.- Add breakpoint descriptions
If you have many breakpoints in your project, you can add descriptions to breakpoints for ease of search. To do this, right-click a breakpoint in the Breakpoints dialog CtrlShiftF8 and select Edit description from the menu. Now when you start typing the breakpoint name, it gets the focus.