Find code issues in specific scope
Design-time code inspection is a great help when you are coding in the editor or reviewing specific files. However, ReSharper also allows you to run static code analysis in the whole solution or narrower scope and examine the results in a friendly view. You can even share inspection results if necessary.
tip
You can also inspect code in a specific scope from the command line without starting Visual Studio and ReSharper.
Decide whether you want the results of the solution-wide inspections (for example, unused public members) to be included in the report. If you want these results to be included, enable the solution wide-analysis. Note that when solution-wide analysis is enabled, ReSharper has to analyze the whole solution even if you need to inspect a single project, so be prepared that it takes more time.
Do one of the following:
From the main menu, choose ReSharper | Inspect | Code Issues in Solution or ReSharper | Inspect | Code Issues in Current Project.
In the Solution Explorer, select items (files, folders, projects, solution folders) that you want to inspect, right-click the selection and choose Find Code Issues in the context menu.
In the Architecture view, select one or more items, right-click the selection and choose Find Code Issues in the context menu.
The Inspection Results window will open displaying detected code issues.
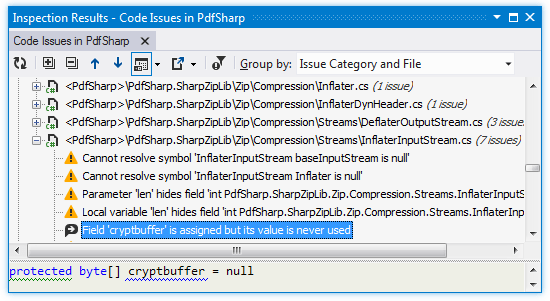
In the Inspection Results window, you can view the list of discovered code issues and locate them in the editor by double-clicking the entries:

If the Inspection Results window was closed, you can reopen it by pressing CtrlAlt0V or choosing ReSharper | Windows | Inspections.
Each new run of code inspection opens a new tab in the window, so the results of previous runs are preserved until you close their tabs.
By default, issues are grouped by files. If necessary, you can regroup issues by type, severity, and so on using the Group by: selector.
To check context of the selected code issue, use the Preview pane that displays one or more lines related to the issue in the code file. Use the Show Preview ![]() selector to open the pane at the bottom or on the right of the window.
selector to open the pane at the bottom or on the right of the window.
When you inspect code, ReSharper apply code inspections with all severity levels. However, issues detected with inspections of 'Hint' severity are filtered out by default. If necessary, you can customize filtering of code issues.
Note that the selected filtering affects the way code issues are filtered in the current tab and the way issues are filtered the next time you run code inspection.
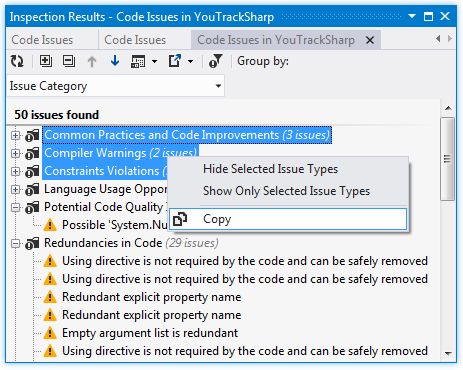
If you want to hide issues of some type or hide all other issues except issues of this type, right-click a code issue and choose Hide All [Issue type] Issues or Show Only [Issue type] Issues correspondingly.
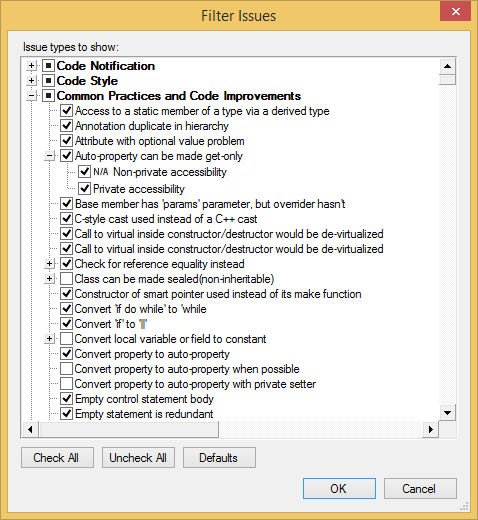
For more precise filtering, click Filter Issues
.png) on the toolbar and use the Filter Issues dialog to specify issue types that should be displayed. The Defaults button in this dialog restores the default filtering when issues with severity levels of 'Hint' are filtered out.
on the toolbar and use the Filter Issues dialog to specify issue types that should be displayed. The Defaults button in this dialog restores the default filtering when issues with severity levels of 'Hint' are filtered out.
In large projects, code inspection results can be used in many different ways. For instance, to assign found issues to different developers: you can copy or export a code issue or a group of issues and submit the copy to an issue tracker.
Both Inspection Results window and Errors/Warnings in Solution window allow exporting code issues into text, HTML, or XML files.
Open code inspection results in the Inspection Results window or enable solution-wide analysis and open the list of errors in the Errors/Warnings in Solution window.
Click Export
.png) on the toolbar to export the data currently displayed in the window in text format , or use the drop-down selector to export the data in an XML or HTML format. The Export Data dialog that appears will help you save the data to a file or copy it to the clipboard .
on the toolbar to export the data currently displayed in the window in text format , or use the drop-down selector to export the data in an XML or HTML format. The Export Data dialog that appears will help you save the data to a file or copy it to the clipboard . An alternative way to export current issues to an XML report, is to choose ReSharper | Inspect | Save Issues Report in the main menu and then specify filename and location.
Saving inspection results to the XML format has several advantages: first, this format is compatible with the output format of the InspectCode command-line tool and JetBrains TeamCity, second, you can later load and study it in the Inspection Results window. Regardless of the tool that was used to generate the XML report, you can always open and examine it with ReSharper.
From the main menu, choose ReSharper | Inspect | Load Saved Issues Report.
Select an XML report file and click Open.
The report is opened in a new tab of the Inspection Results window. If the current solution corresponds to that of the XML report, you will be able to navigate to the issues by double-clicking on the inspection result items.
Besides exporting, you can copy individual entries or custom selections of entries shown in the Inspection Results window and Errors/Warnings in Solution window to the clipboard. The copied issue information include names of project and solution, filename and line number as well as the description of the issue. For example:
Solution MySolution.sln
Project MyProject
MyProject\About.aspx.cs:2 Using directive is not required by the code and can be safely removedSelect one or more code issues, or issue groups in the Inspection Results window or Errors/Warnings in Solution window.
Right-click the selection and choose Copy in the context menu.
Paste the copied issues where appropriate.
