What's New in CLion 2025.1
CLion 2025.1 brings new features and improvements to the CLion Nova language engine, along with updates for debugging, embedded development, and project formats. It also offers a variety of free and enhanced AI Assistant features, such as the ability to handle natural language prompts in your C/C++ code and multi-file edits directly from the chat.
Key updates
Support for out-of-project files in CLion Nova
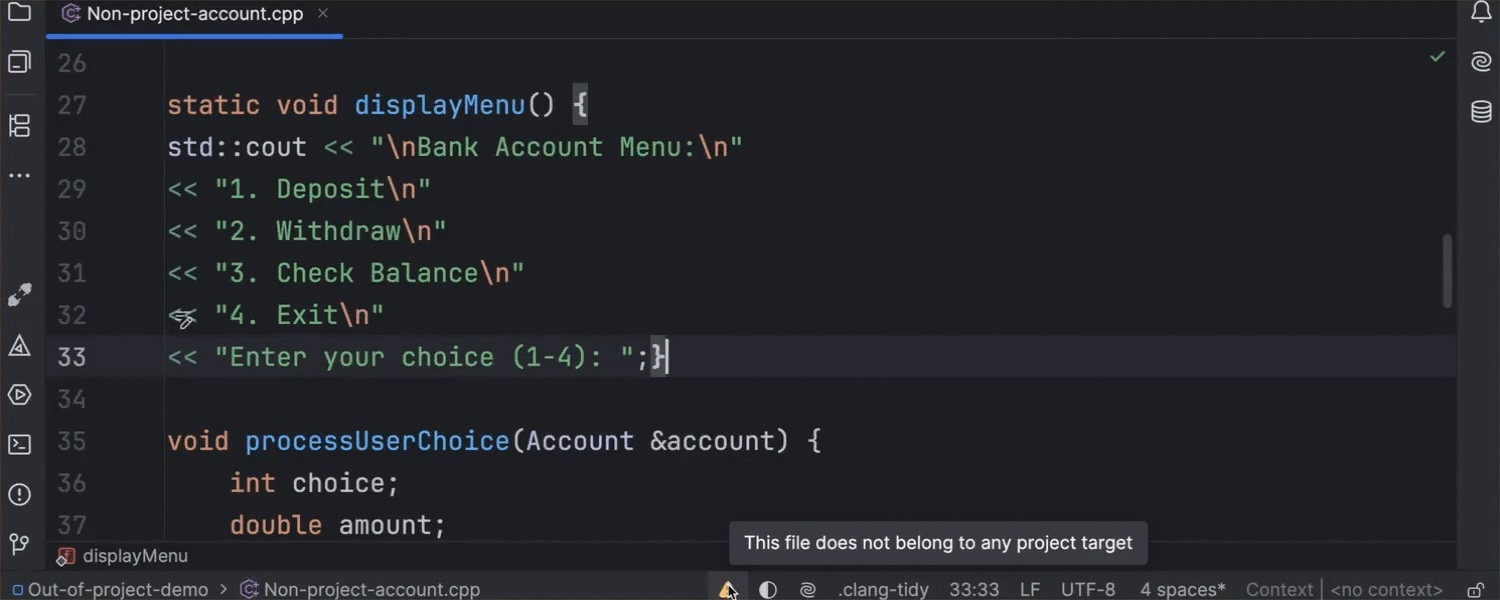
CLion Nova now provides complete code analysis and code assistance functionality for
header and source files that are not included in a project. This can be helpful, for
example, when you just need to edit some code in a .cpp file that is not
part of the build.
Qt renderers in the debugger
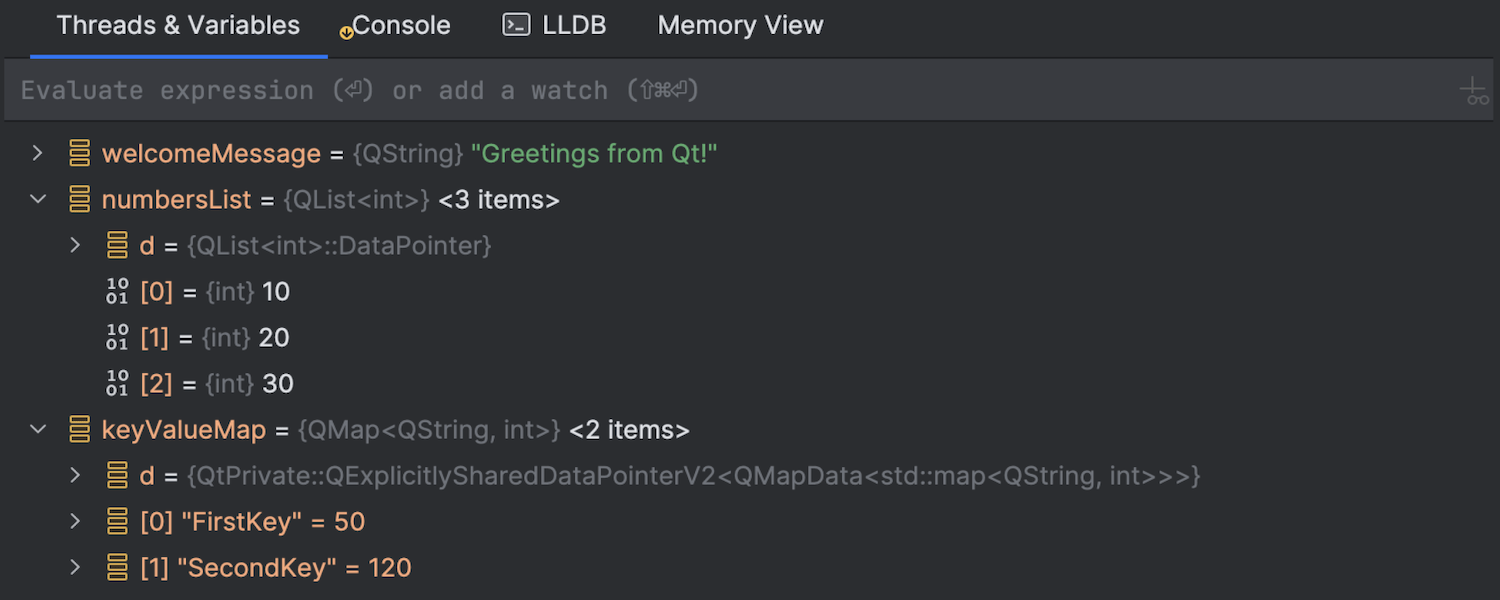
When you’re examining a suspended Qt application, the debugger now allows you to view variables in a human-readable form. This makes it easier to develop and debug cross-platform applications with the Qt framework in CLion.
ST-LINK debug server experimental
We’ve added an ST-LINK debug server template designed specifically for STM32 chips. It contains only the most basic and essential settings, simplifying debugging for STM32 projects.
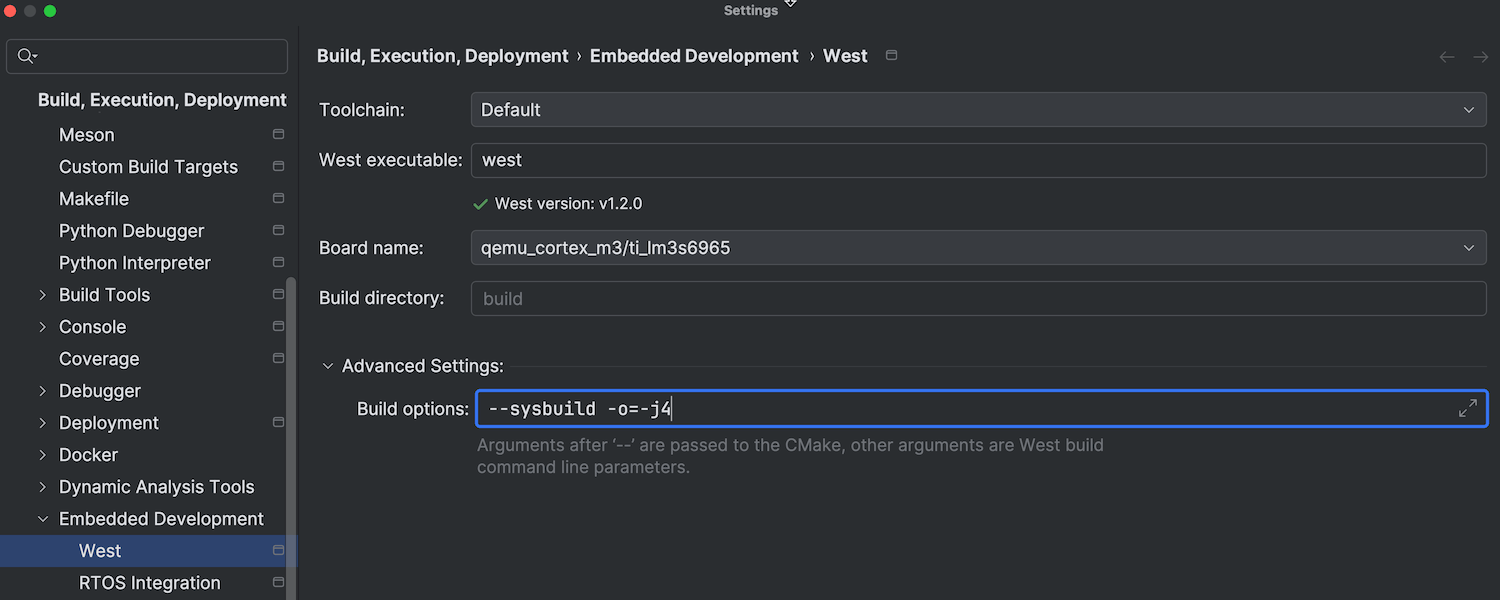
west build options and sysbuild support
When working with Zephyr projects, you can now use the west build command
options, as
well as sysbuild as your primary build system. This provides more flexibility when
configuring Zephyr projects, including those involving hardware.
Free AI Assistant features
All AI Assistant features are now free in CLion and other JetBrains IDEs. Some of these features, such as unlimited code completion and local model support, are completely unlimited, while others have limited credit-based access. A new subscription system makes it easy to scale up as needed with the AI Pro and AI Ultimate tiers.
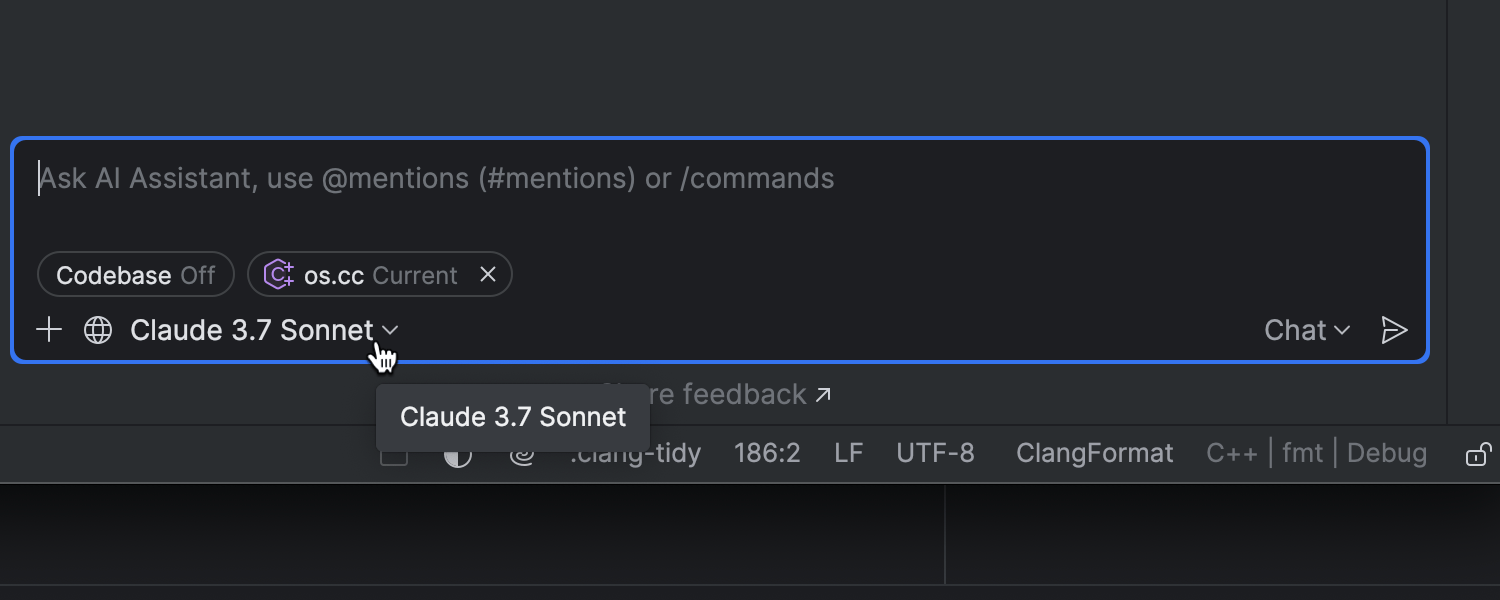
Among the new features are multi-file edits directly from the chat and support for cloud models like Claude 3.7 Sonnet, OpenAI GPT-4.1 (сoming soon), and Gemini 2.0 Flash.
CLion Nova
Out-of-project files
CLion Nova now correctly supports header and source files that are not included in a project and are not used during the build process. This means you get complete code analysis and code assistance functionality when working with these files, just like with regular project files.
For example, you may want to open a .cpp file that is not included in your
project just
to edit some code fragments. You can now do this while benefitting from all the
available essential features, such as code formatting, typing assistance, code
completion, and more.
The current implementation covers most uses, and we also plan to collect feedback to address some edge cases.
Basic support for Objective-C
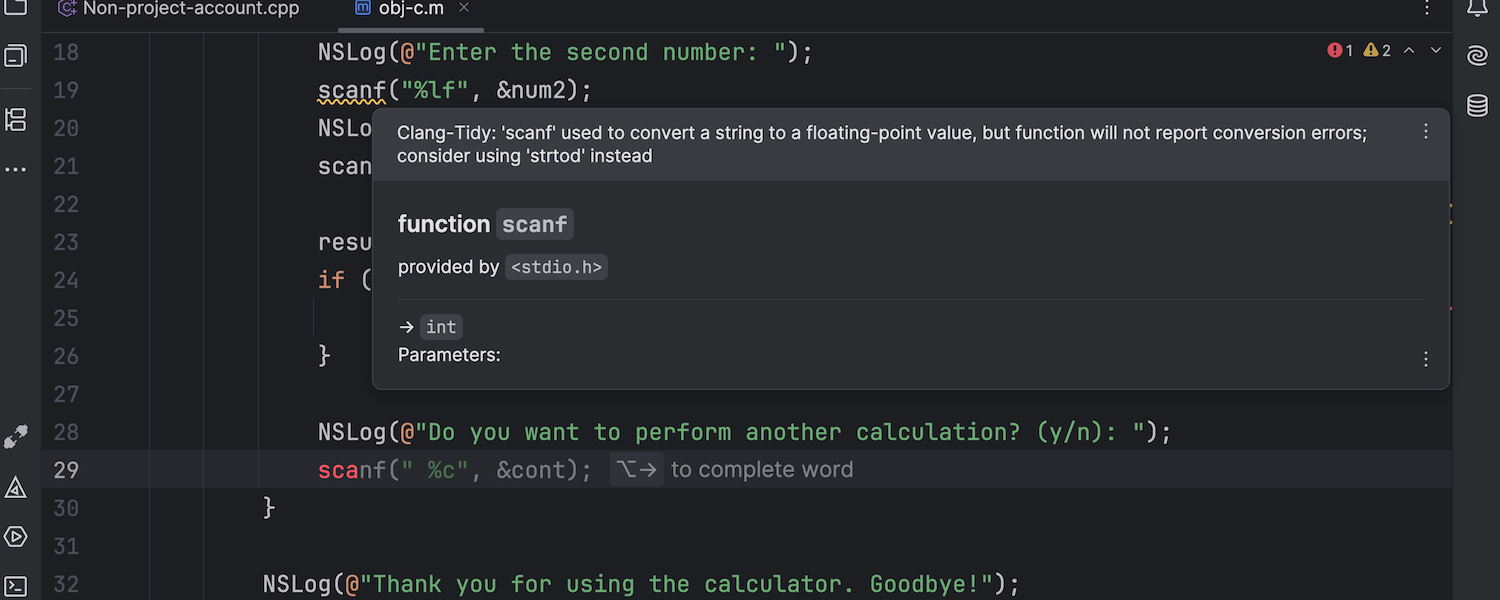
You can now get syntax highlighting, warnings, code completion suggestions, and other features provided by clangd when working with Objective-C source files.
Because this is still basic support, some features, such as the editor’s smart keys and refactorings, may not work. Additionally, CLion Nova may not handle Objective-C header files correctly. If you’re interested in full Objective-C support in CLion Nova, please follow or upvote CPP-37281.
Settings, actions, and smart keys
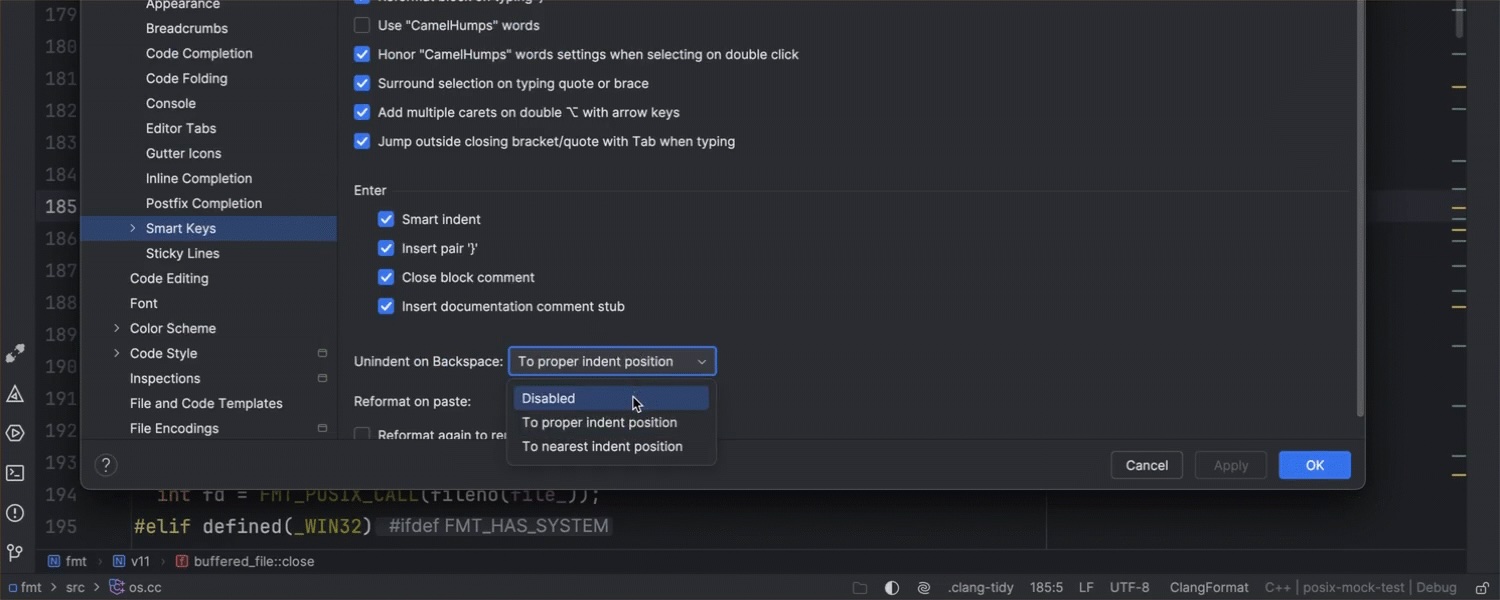
CLion Nova has received several settings, actions, and smart keys that were previously only available in CLion Classic. These features make development with the CLion Nova even more convenient. Here are some examples:
- C/C++ auto-import options such as Auto import local files with quotes and Auto import on completion.
- Some editor actions, including the ability to move the caret to the start or end of a code block using a shortcut.
- Some smart keys such as Unindent on Backspace and Surround selection on typing quote or brace.
GoogleTest and Catch2 support in Bazel projects
CLion Nova now supports using the GoogleTest and Catch2 testing frameworks in Bazel projects.
To learn more about the basics of unit testing and how to use testing tools in CLion, read our tutorial.
Debugger
Qt renderers
Qt renderers, also known as Qt pretty printers and Qt debugging helpers, allow you to view Qt variables, such as QString, QList, and QByteArray, in a human-readable form. This makes developing and debugging applications built using the Qt framework much more convenient.
This feature is enabled by default, but to use it, you need to download the Qt renderers and specify the path to them:
- Go to Settings | Build, Execution, Deployment | Debugger | Data Views | C/C++ | Enable Qt renderers.
- Click Download… next to the Qt renderers field.
- When the Download Qt Renderers window appears, click Download Qt Renderers. Once the download is complete, the path will be specified automatically.
- Click OK.
Note that Qt renderers don’t yet work with remote and WSL toolchains.
Support for custom LLDB debuggers
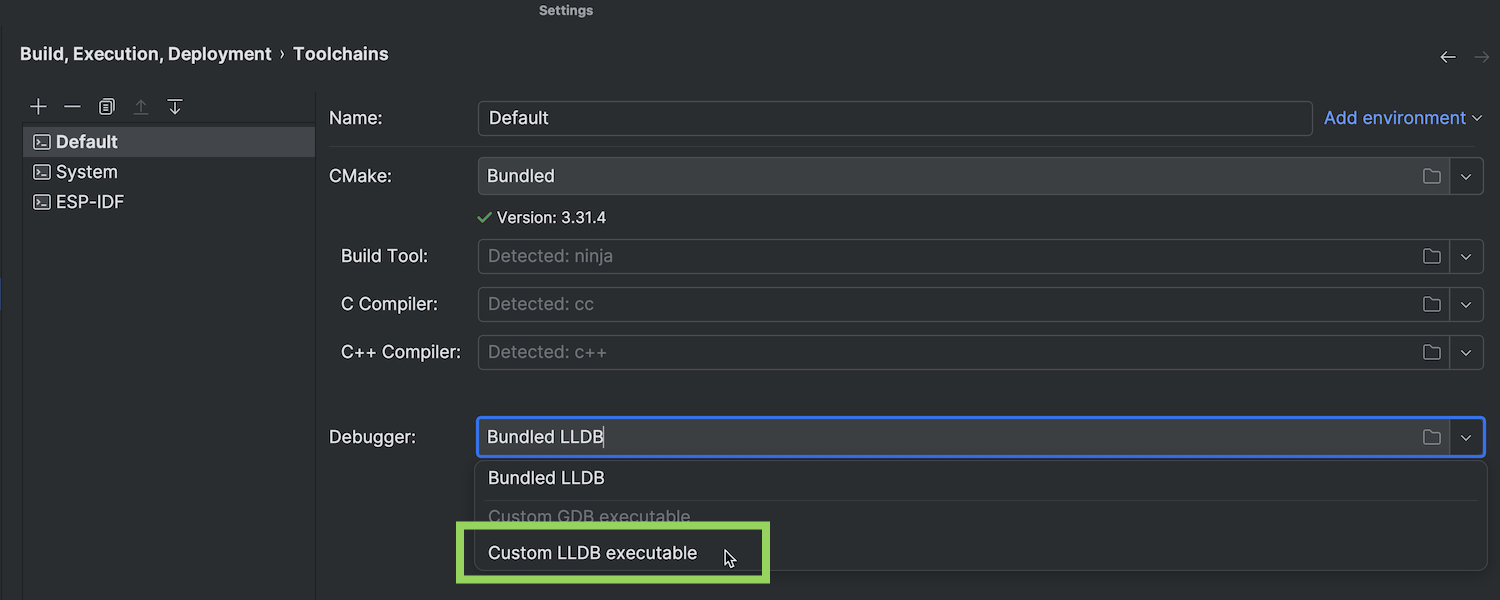
In addition to the bundled LLDB, which is currently v19.1.3, you can now use a custom LLDB when working on macOS or Linux. This allows you to choose the version of LLDB best suited to the requirements of your project.
Go to Settings | Toolchains and select Custom LLDB executable in the Debugger field. CLion will then automatically try to find the custom LLDB installed on your system. You can also manually specify its location.
The current limitations:
- Custom LLDBs don’t yet work with the WSL, Docker, or Remote Host toolchains.
- Custom LLDBs are available for macOS and Linux but are not currently supported on Windows.
Option to view two-channel OpenCV matrices as images
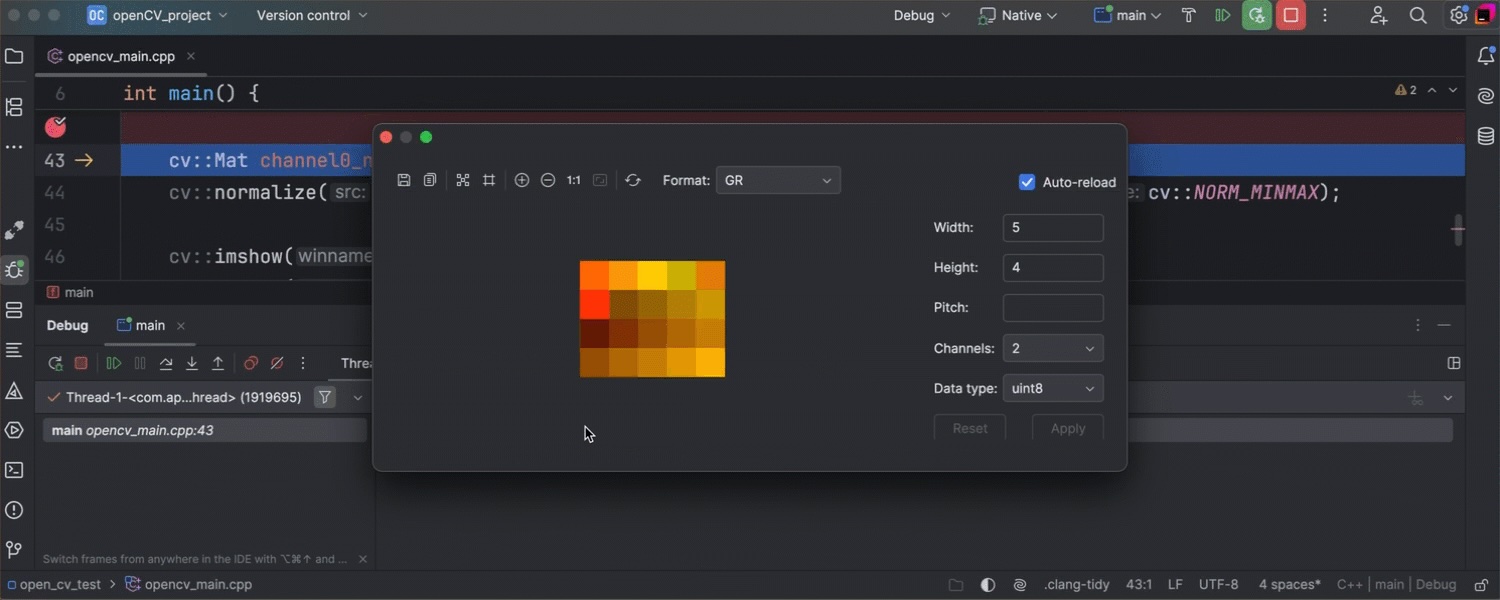
When debugging a computer vision or ML application that uses OpenCV, you can view OpenCV matrices as images. CLion 2025.1 extends this
functionality, allowing you to view two-channel matrices – such as cv::Mat m(2, 3, CV_8UC2) – as images.
To view a two-channel OpenCV matrix in your code as an image, select the debugger’s Threads & Variables pane, navigate to the matrix, and click View as image.
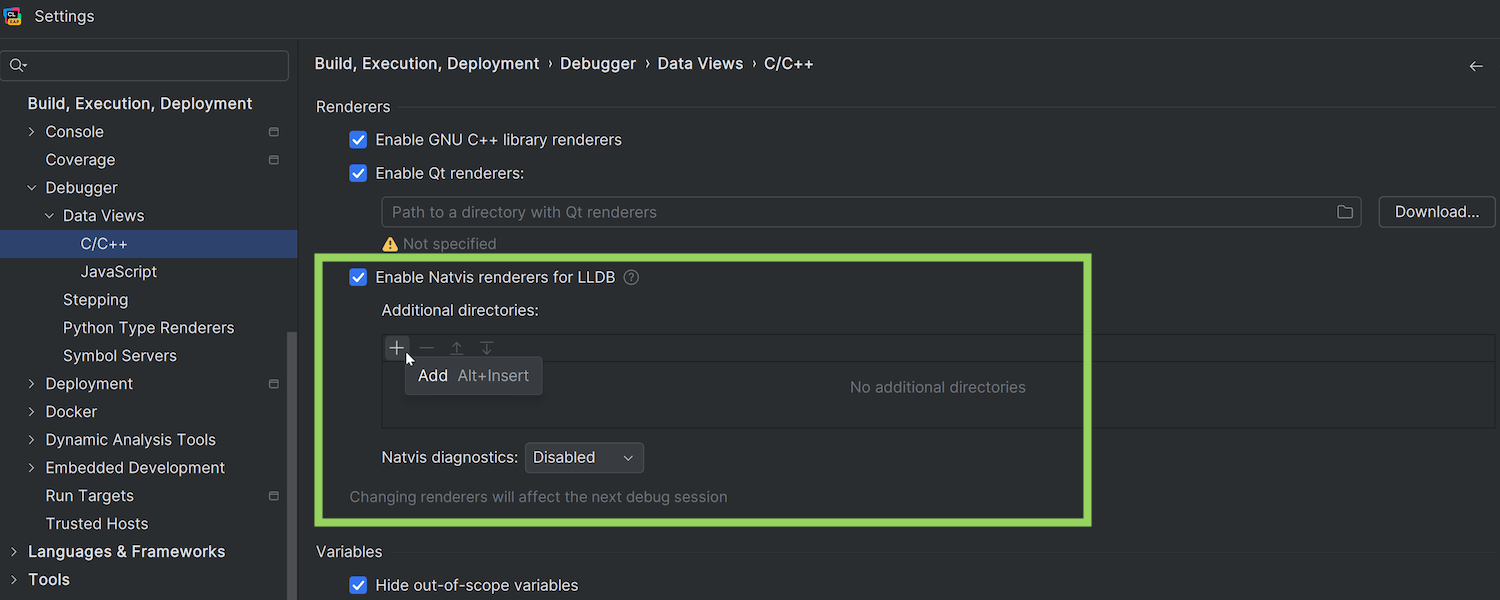
Custom location for .natvis files
Natvis renderers, or Natvis visualizers, allow you to define visualization rules for
different data types when working with the MSVC debugger. Previously, CLion could only
load .natvis files from a project directory, which wasn’t flexible enough,
especially when using Git or other version control systems. Now, you can specify a
custom location for your .natvis files.
Go to Settings | Build, Execution, Deployment | Debugger | Data Views | C/C++ and add an additional directory with Natvis renderers. You can learn more about working with Natvis files in the documentation.
Embedded development
ST-LINK debug server experimental
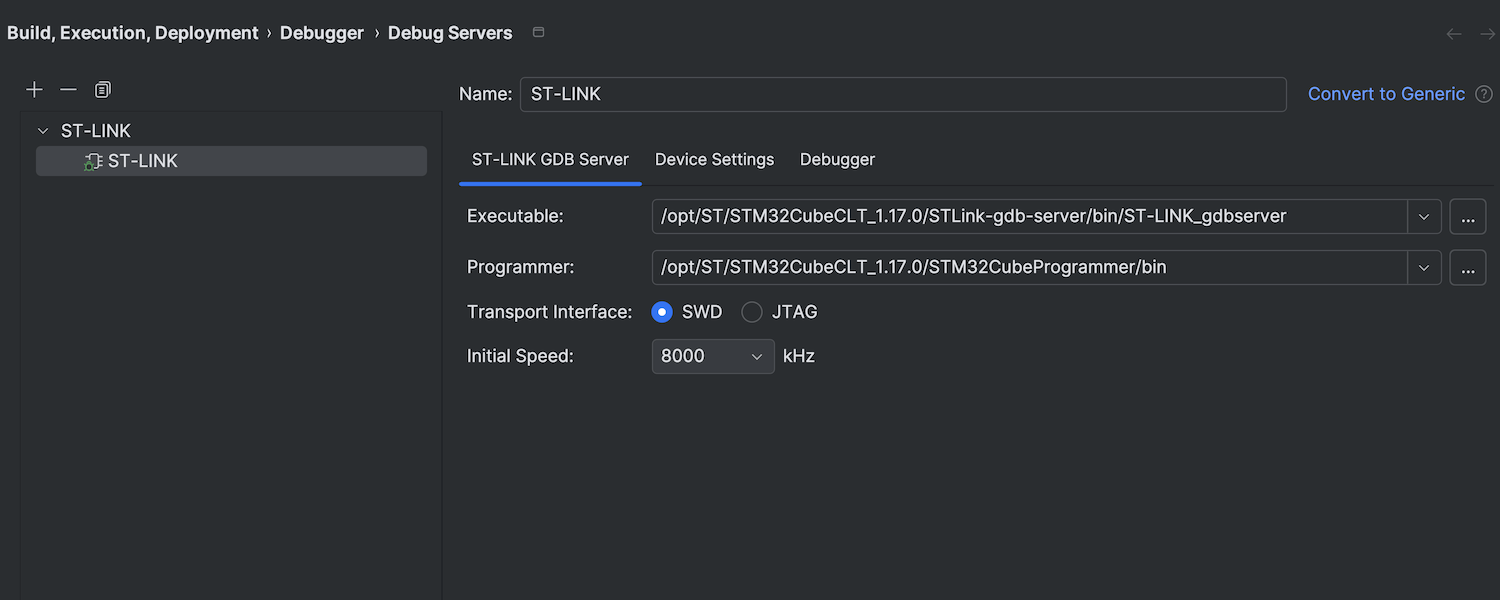
When debugging STM32 projects, you can now use the ST-LINK debug server template, which was designed specifically for STM32 chips. It contains only the most basic and essential settings, simplifying the configuration process.
Go to Settings | Build, Execution, Deployment | Debugger | Debug Servers, click +, and select the ST-LINK template. Then, configure your debug server, device, and debugger parameters.
Note that the ST-LINK configuration option only works with:
- The ST-LINK GDB server shipped with STM32CubeCLT and STM32CubeIDE.
- ST-LINK/V2 and ST-LINK/V3 probes.
- Single and dual-core MCUs.
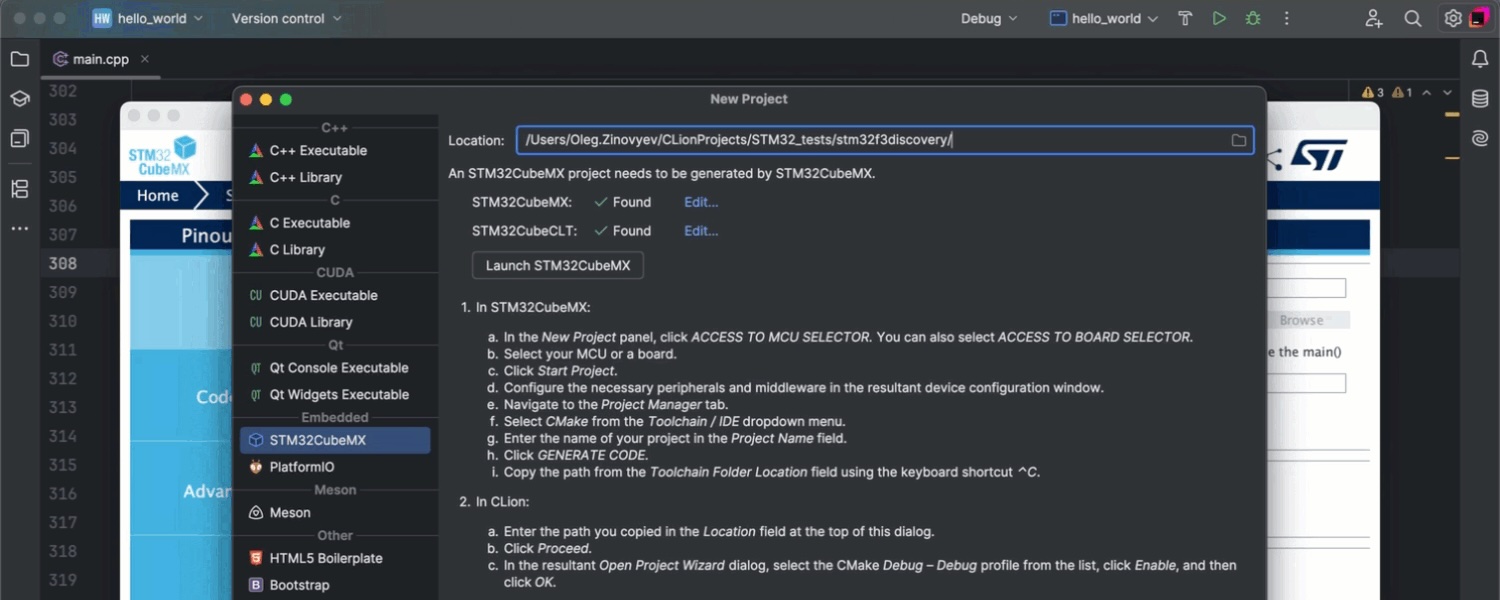
STM32CubeMX New Project wizard
We’ve updated the STM32CubeMX project creation process to improve usability and extend support to a wider range of STM32 chips and projects. By using the native STM32CubeMX approach to generate CMake files, CLion ensures that project creation is fully aligned with the official STM32CubeMX workflow and toolchain.
We’ll continue to improve the STM32CubeMX New Project wizard, and your feedback is very much appreciated (CPP-42553).
Serial Port Monitor plugin improvements
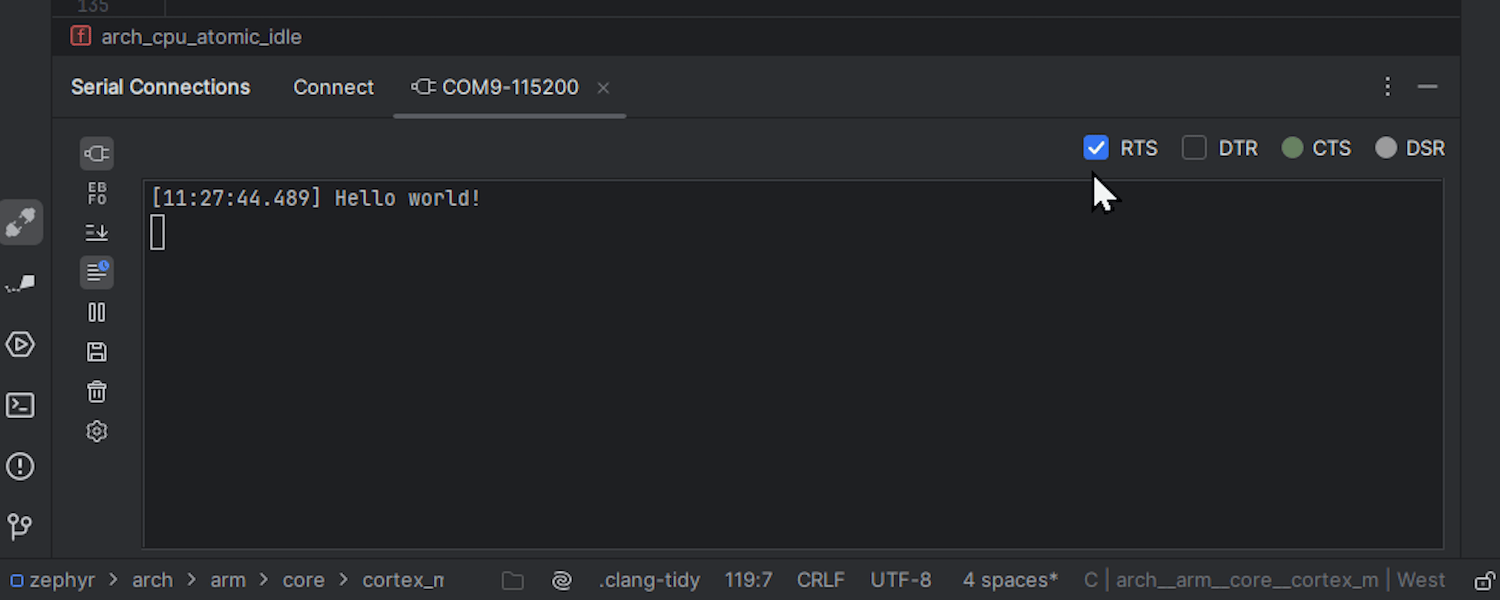
You can now view and manage DTR, DSR, RTS, and CTS hardware control signals when working with the Serial Port Monitor plugin. This gives you more control over attached devices that use a serial port such as Arduino and ESP32.
To enable hardware control signals:
- In the Serial Connections tool window, navigate to the Connect tab.
- Select the desired COM port.
- Click the Show HW controls checkbox.
The control options and indicators will then appear in the COM port tab.
You can also view timestamps in the monitor output, which is useful for tracking message sequences in detail.
Project formats and build tools
west build options and sysbuild support
When working with Zephyr projects, you can now use the west build command
options, as well as sysbuild as your primary build system. Both of these features
provide more flexibility when it comes to configuring Zephyr projects, including those
involving hardware.
Use Settings | Build, Execution, Deployment | Embedded Development
| West | Advanced Settings to pass additional parameters for the west
build command – for example, a path to a custom board or options for the
underlying
build tool.
Sysbuild provides the ability to build multiple images for boards
with multiple SoCs (systems on chip) or SoCs with multiple CPU cores. You can enable
sysbuild from the same Advanced Settings section by passing
--sysbuild along with any other options you want.
CMake Presets v10
The bundled CMake version has been updated to v3.31.4, and includes support for CMake Presets v10. Presets are stored as JSON files and are useful when you want to specify common configuration and build options for a CMake project to share them with other users.
AI Assistant updates
Free tier, new cloud models, and more
All AI Assistant features are now free in CLion and other JetBrains IDEs, which makes AI-powered development more accessible and efficient. Some of these features, such as unlimited code completion and local model support, are completely unlimited, while others have limited credit-based access. A new subscription system makes it easy to scale up as needed with the AI Pro and AI Ultimate tiers.
Other enhancements increase productivity and reduce repetitive tasks:
- Smarter code completion.
- Support for new cloud models like Claude 3.7 Sonnet, OpenAI GPT-4.1 (сoming soon), and Gemini 2.0 Flash.
- Advanced RAG-based context awareness.
- A new edit mode for multi-file edits directly from the chat.
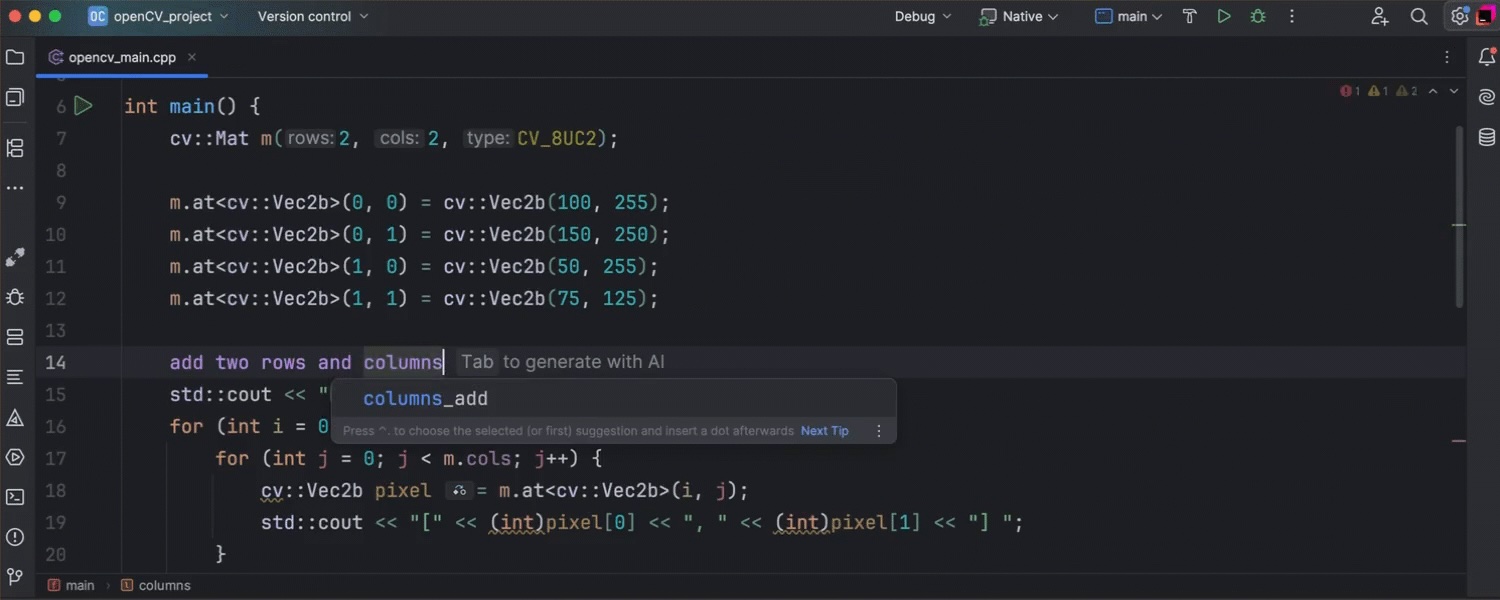
Natural language inline prompts for C/C++
AI Assistant has learned to understand natural language prompts for C/C++. After you write a prompt and press Tab, AI Assistant interprets it and translates it into code changes, taking into account the context of your project. If you want to improve some of the suggested changes, you can undo them, modify your prompt, or add a follow-up message.

