Notebooks
At the heart of any data science project is a Jupyter notebook. Datalore gives you smart tools to work with Jupyter notebooks. Rely on its smart coding assistance for Python, SQL, R, Scala, and Kotlin to move faster and write higher-quality code with less effort. The Datalore editor gives you quick access to all the essential tools, including attached data sources, automatic visualizations, dataset statistics, report builder, environment manager, versioning, and more.
Watch the video below to see how easy it is to create Jupyter notebooks in Datalore:
Jupyter compatible

Notebooks in Datalore are Jupyter compatible, meaning you can upload your existing IPYNB files and continue working with them in Datalore. Furthermore, you can also export notebooks as IPYNB files. Note that data connections and interactive controls won’t be exported.
Python notebooks

Smart coding assistance from PyCharm
Datalore comes bundled with code insight features from PyCharm. For Python notebooks you get first-class code completion, parameter info, inspections, quick-fixes, and refactorings that help you write higher-quality code with less effort.

In-app documentation
Get documentation pop-ups for any method, function, package, or class. Datalore will show you the documentation right where you need it.

Conda and pip support
Datalore supports both pip and conda. Pip is fast and free for everyone, whereas conda is free for non-commercial use only.
Kotlin, Scala, and R notebooks
In Datalore you can create Kotlin, Scala, and R notebooks. You can use magics to install packages, and when writing code, you’ll get code completion.

SQL cells
Add native SQL cells to query your database connections. In addition to SQL syntax-highlighting, you also get code completion based on the introspected database tables. The query result is automatically transferred to a pandas DataFrame and you can continue working on the dataset in Python.

Query DataFrames via SQL cells
Use SQL cells to easily query 2D DataFrames and CSV files from attached documents, just like you would with databases. Simply browse through your notebook’s DataFrames, pick one, and use it as your source for SQL cells. With this feature, you can merge data from various sources into a single DataFrame using SQL or break down complex queries into a sequence of SQL cells.

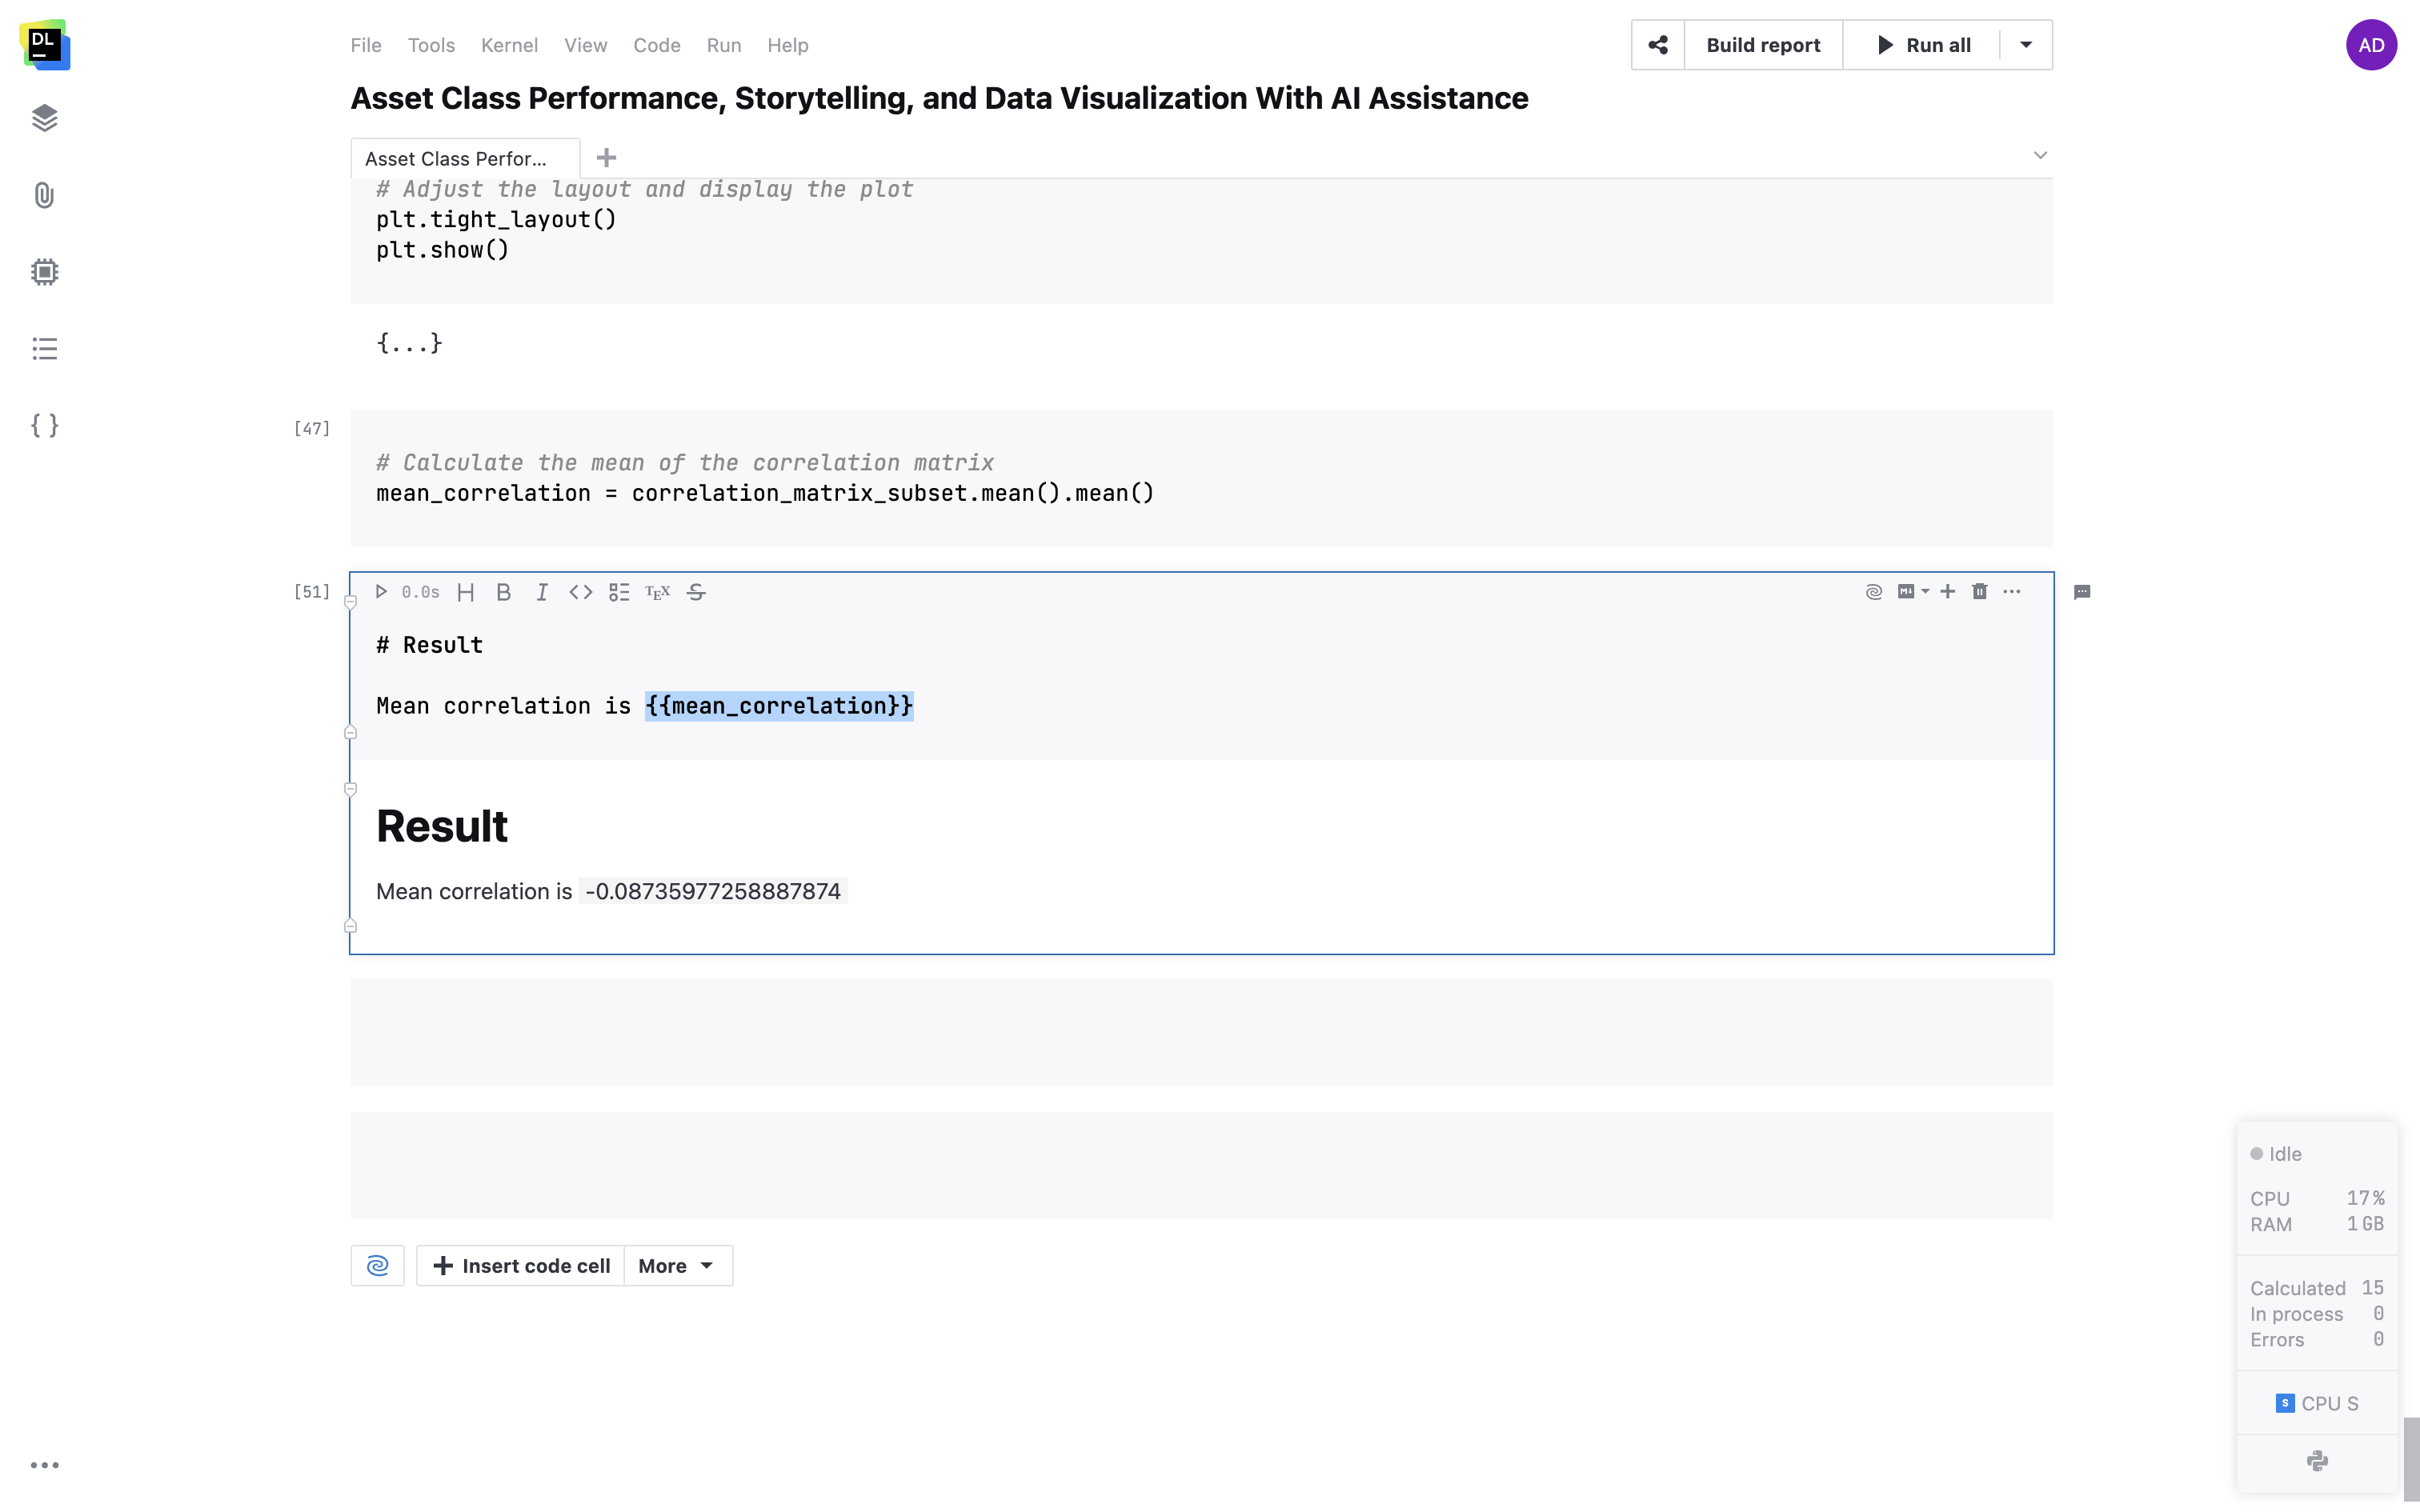
Support for variables in Markdown cells
Embed your variables in Markdown cells with double curly brackets. Variables will dynamically convert to their live values within your text.

Environment

Package manager
Datalore comes with an integrated package manager that makes your environment reproducible. The package manager allows you to install and manage new packages and makes sure they persist when you reopen the notebook.
Custom base environments
Create multiple base environments from custom Docker images. You can pre-configure all the dependencies, package versions, and build tool configurations so that your team doesn’t spend time manually installing things and syncing the package versions.
Packages from Git repositories
Install a custom pip-compatible package from a Git repository by attaching a Git branch to your notebook.
Initialization scripts
Configure a script that you want to run before the notebook starts. Here you can specify all the necessary build tools and required dependencies.
Visualizations
Visualize tab
Get automatic visualization options inside the Visualize tab for any pandas DataFrame. Point, Line, Bar, Area, and Correlation plots will help you quickly understand the contents of your data. If the dataset is big it will be automatically sampled. All plots can be then extracted to code or Chart cells for further customization.
Support for all Python visualization packages
Create visualizations with the package of your choice. Matplotlib, plotly, altair, seaborn, lets-plot, and many other packages are supported in Datalore notebooks.

Chart cells
Create production-ready visualizations with just a few clicks. The state of the cells is shared with collaborators so you can work on the visualization together.
Interactive table output
Apply filtering and sorting to Pandas DataFrames and SQL query results directly in the cell output. Select the columns to display, sort the dataset by a specific column, filter based on “equals” and “contains” expressions, and easily jump to the top or bottom of the dataset. After you complete the filtering and sorting, use the Export to code cell option to generate the Pandas code snippet and make the table view reproducible.

Edit DataFrame cells in interactive tables
You no longer need to download CSV files to make a set of edits in a DataFrame. You can simply edit the content of cells inside interactive tables and click Export to code to reproduce the result in the notebook.

DataFrame statistics
With one click, you can get essential descriptive statistics for a DataFrame inside a separate Statistics tab. For categorical columns, you will see the distribution of values, and for numerical columns, Datalore will calculate the min, max, median, standard deviation, percentiles, and also highlight the percentage of zeros and outliers.

Interactive controls
Add interactive inputs such as dropdowns, sliders, text inputs, and date cells inside your notebooks, and use the input values as variables inside your code. Present the visualizations with Chart cells and highlight specific numbers within Metric cells.

File uploader interactive control
Report and notebook owners can now enable collaborators to upload CSV, TXT, or image files from their local machines. Set file types and size limits to seamlessly incorporate file uploading into your workflow.

Export to database cell
Export DataFrames to existing tables in a database directly from your notebook. Customize the export by picking the DataFrame, target database, schema, and table. You can also take advantage of the scheduling feature and automate the exports.

IPyWidgets support
Datalore supports IPyWidgets, the classic Jupyter widgets framework. Add interactive controls with Python code, combine multiple widgets in one cell output, and use the selection as a variable in the following parts of your notebook.

CSV file previews
Open CSV and TSV files from the Attached data tab in a separate tab inside Datalore’s editor. Sort the column values and paginate the file contents.

CSV file editing
Create and edit CSV and TSV files right inside the Datalore editor. You can start from scratch and create a new file or you can edit the contents of an existing one.

Terminal
Open Terminal windows inside the editor, execute .py scripts, and access the agent, environment, and file system using standard bash commands.

Variable viewer
Browse notebook variables and built-in parameter values from one place.

Internal versioning
Create custom history checkpoints that enable you to revert the changes at any time using the history tool. When browsing a checkpoint, you will see the difference between the current version of the notebook and the one that is selected.

Computation
Run notebooks on CPUs and GPUs
In Datalore, you can execute your notebooks on CPUs and GPUs. You can choose the machine you need from the UI. The type and amount of resources you get depends on which plan you have. Find more information here.

Private cloud and on-premises machines
You can connect any type of server hardware you are already using to Datalore and make it accessible to your users from Datalore’s interface.
Reactive mode for reproducible research
Reactive mode will enforce top-down evaluation order and automatic recalculation of the cells below the modified one. The notebook state will be saved after each cell evaluation and can be restored at any time.
Background computation
Switch on Background computation to keep your notebook running even when you close the browser tab. You will always have access to your running computations list from the User menu or the Admin panel.
Machine usage reports
Download CSV reports containing the amount of time you spent running each machine – it might help you understand which projects you’ve paid most attention to.
Notebook scheduling
Use scheduling to run your notebooks on an hourly, daily, weekly, or monthly basis and deliver regular updates to published reports. Choose the schedule parameters from the user interface or use the CRON string. Notify notebook collaborators upon successful or failed runs via email.

Multiple notebook schedules
Specify and manage multiple schedules for a single notebook through the user interface. This feature allows you to create custom schedules and run your notebook hourly, daily, weekly, or on specific dates. With the ability to set up different schedules based on your unique needs, you can achieve more efficient resource allocation and tailor the code execution timings to your project’s demands.

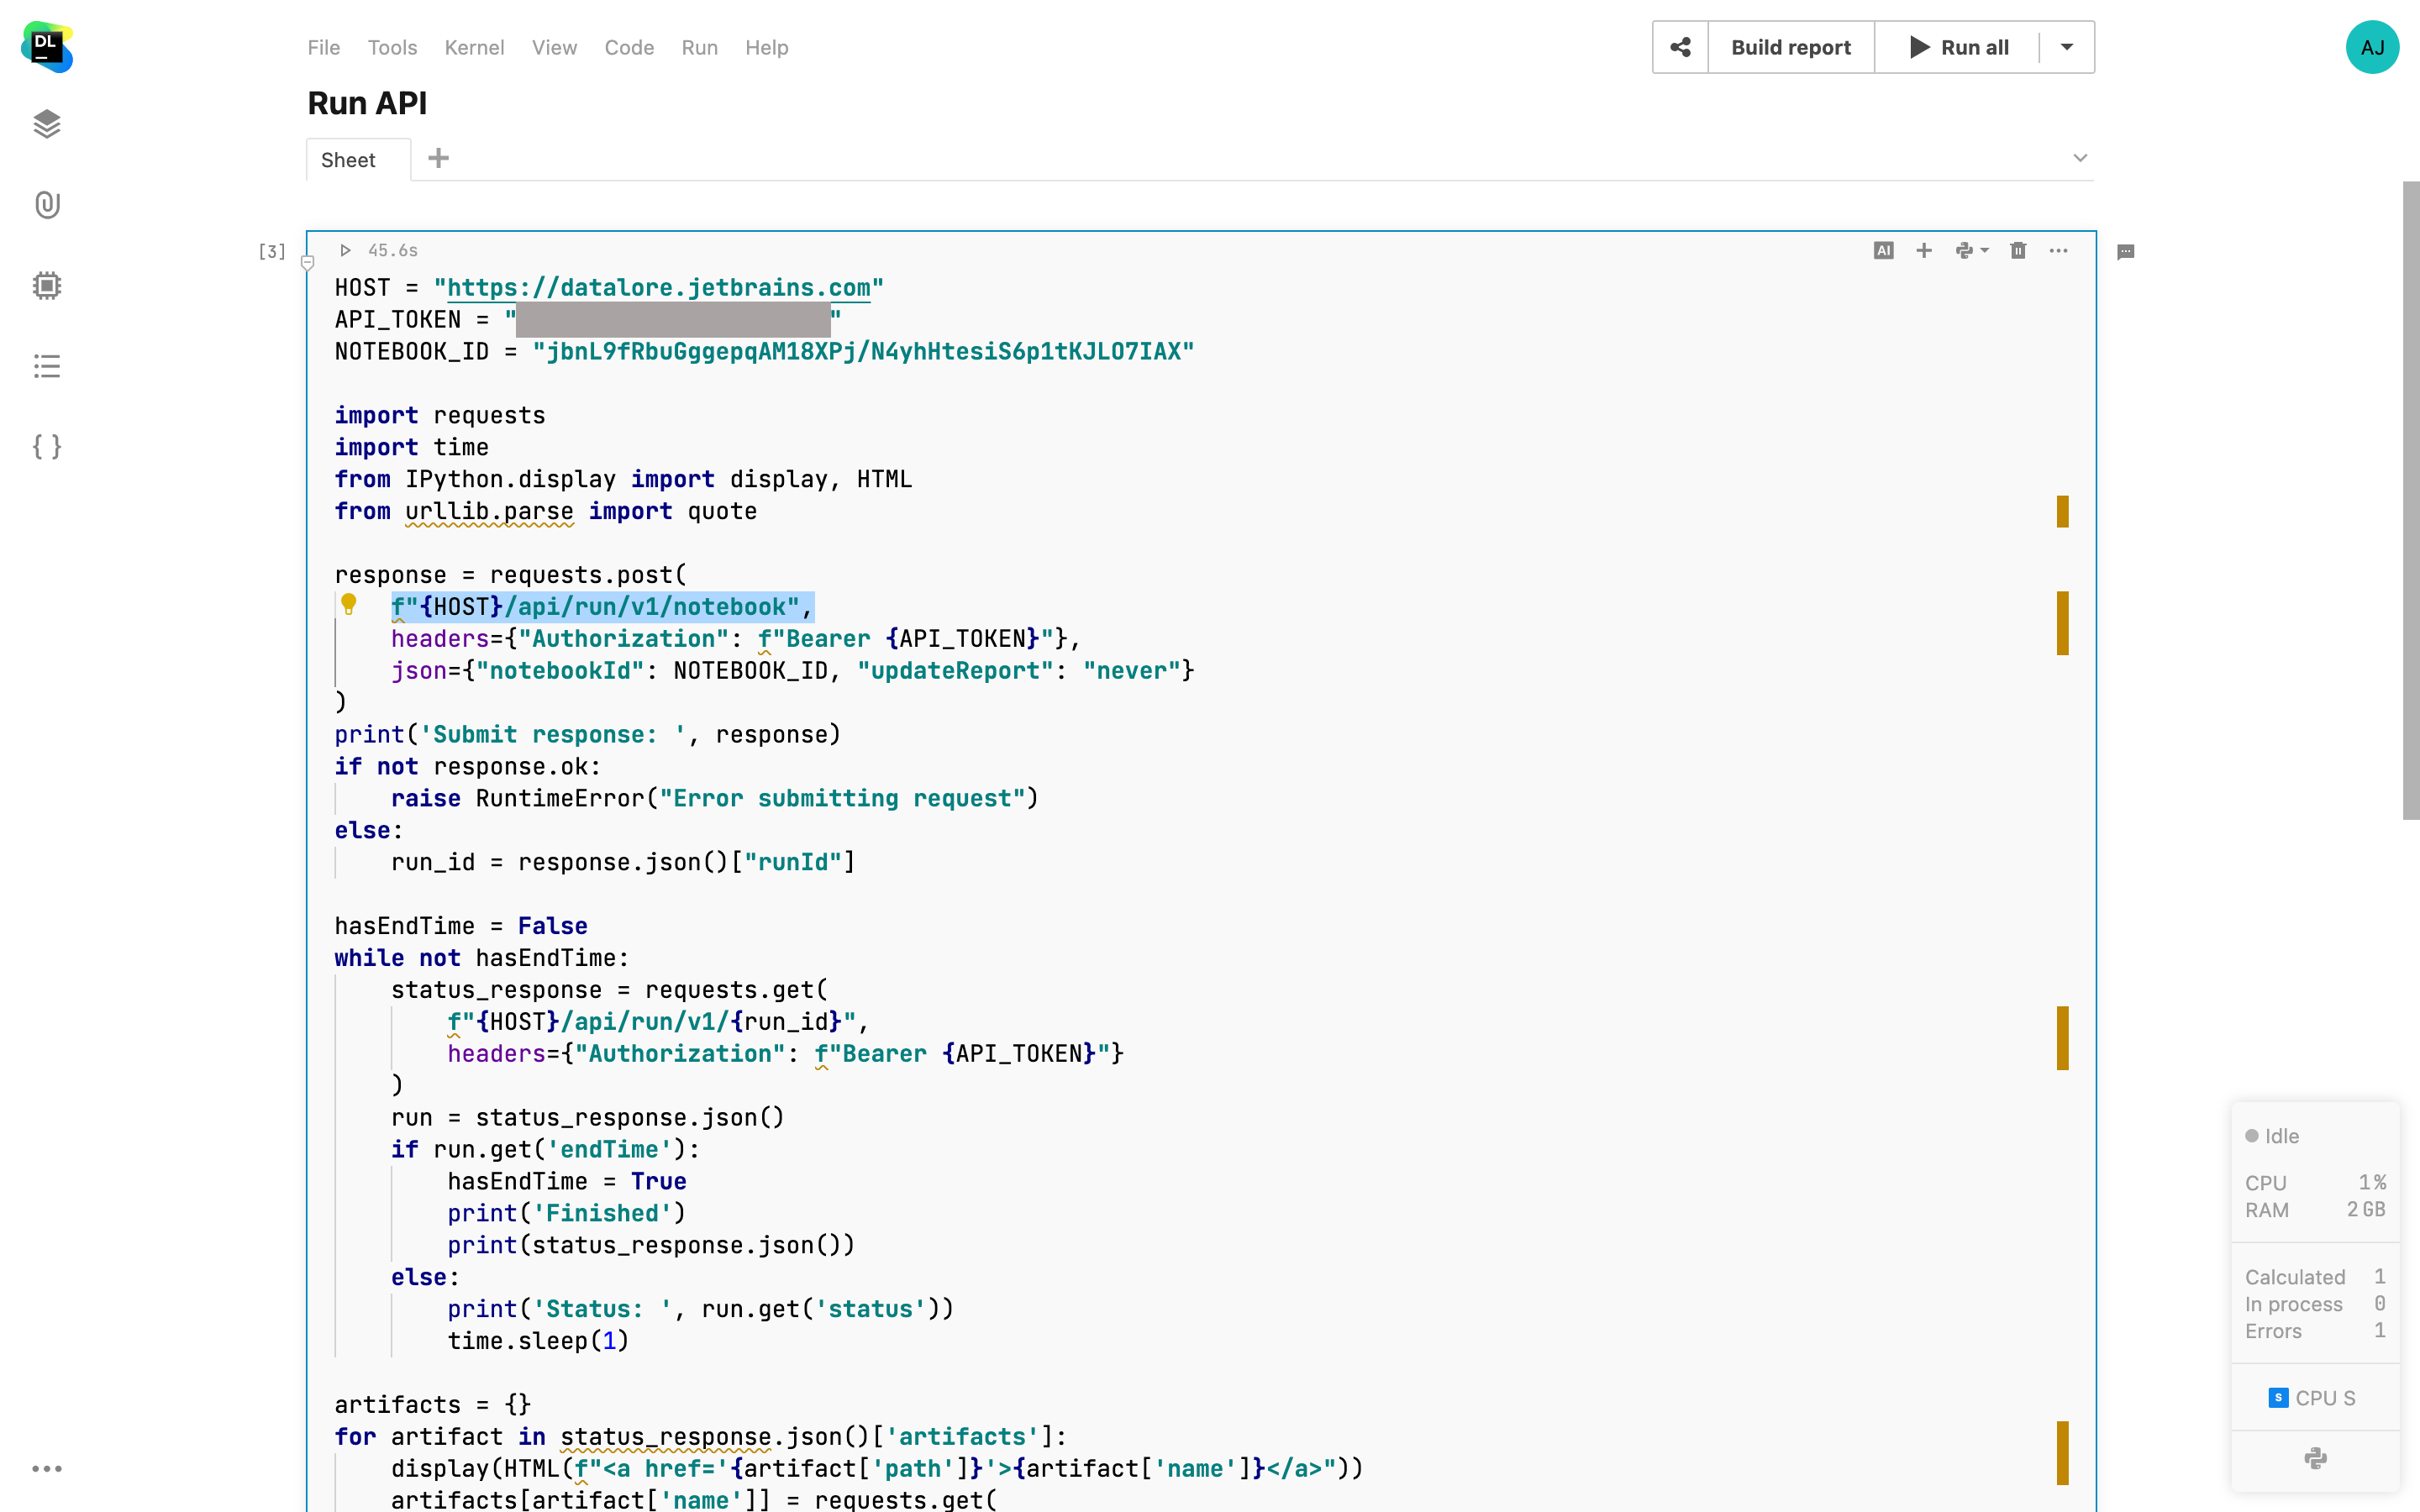
Datalore Run API
It is now possible to trigger running a Datalore notebook or republishing a report with an API call. This feature is an addition to scheduled runs, which allows you to trigger rerunning a notebook on-demand from external apps and internal Datalore notebooks. It is also possible to view the run results from the Scheduled run menu. More information on how to use the API can be found here.

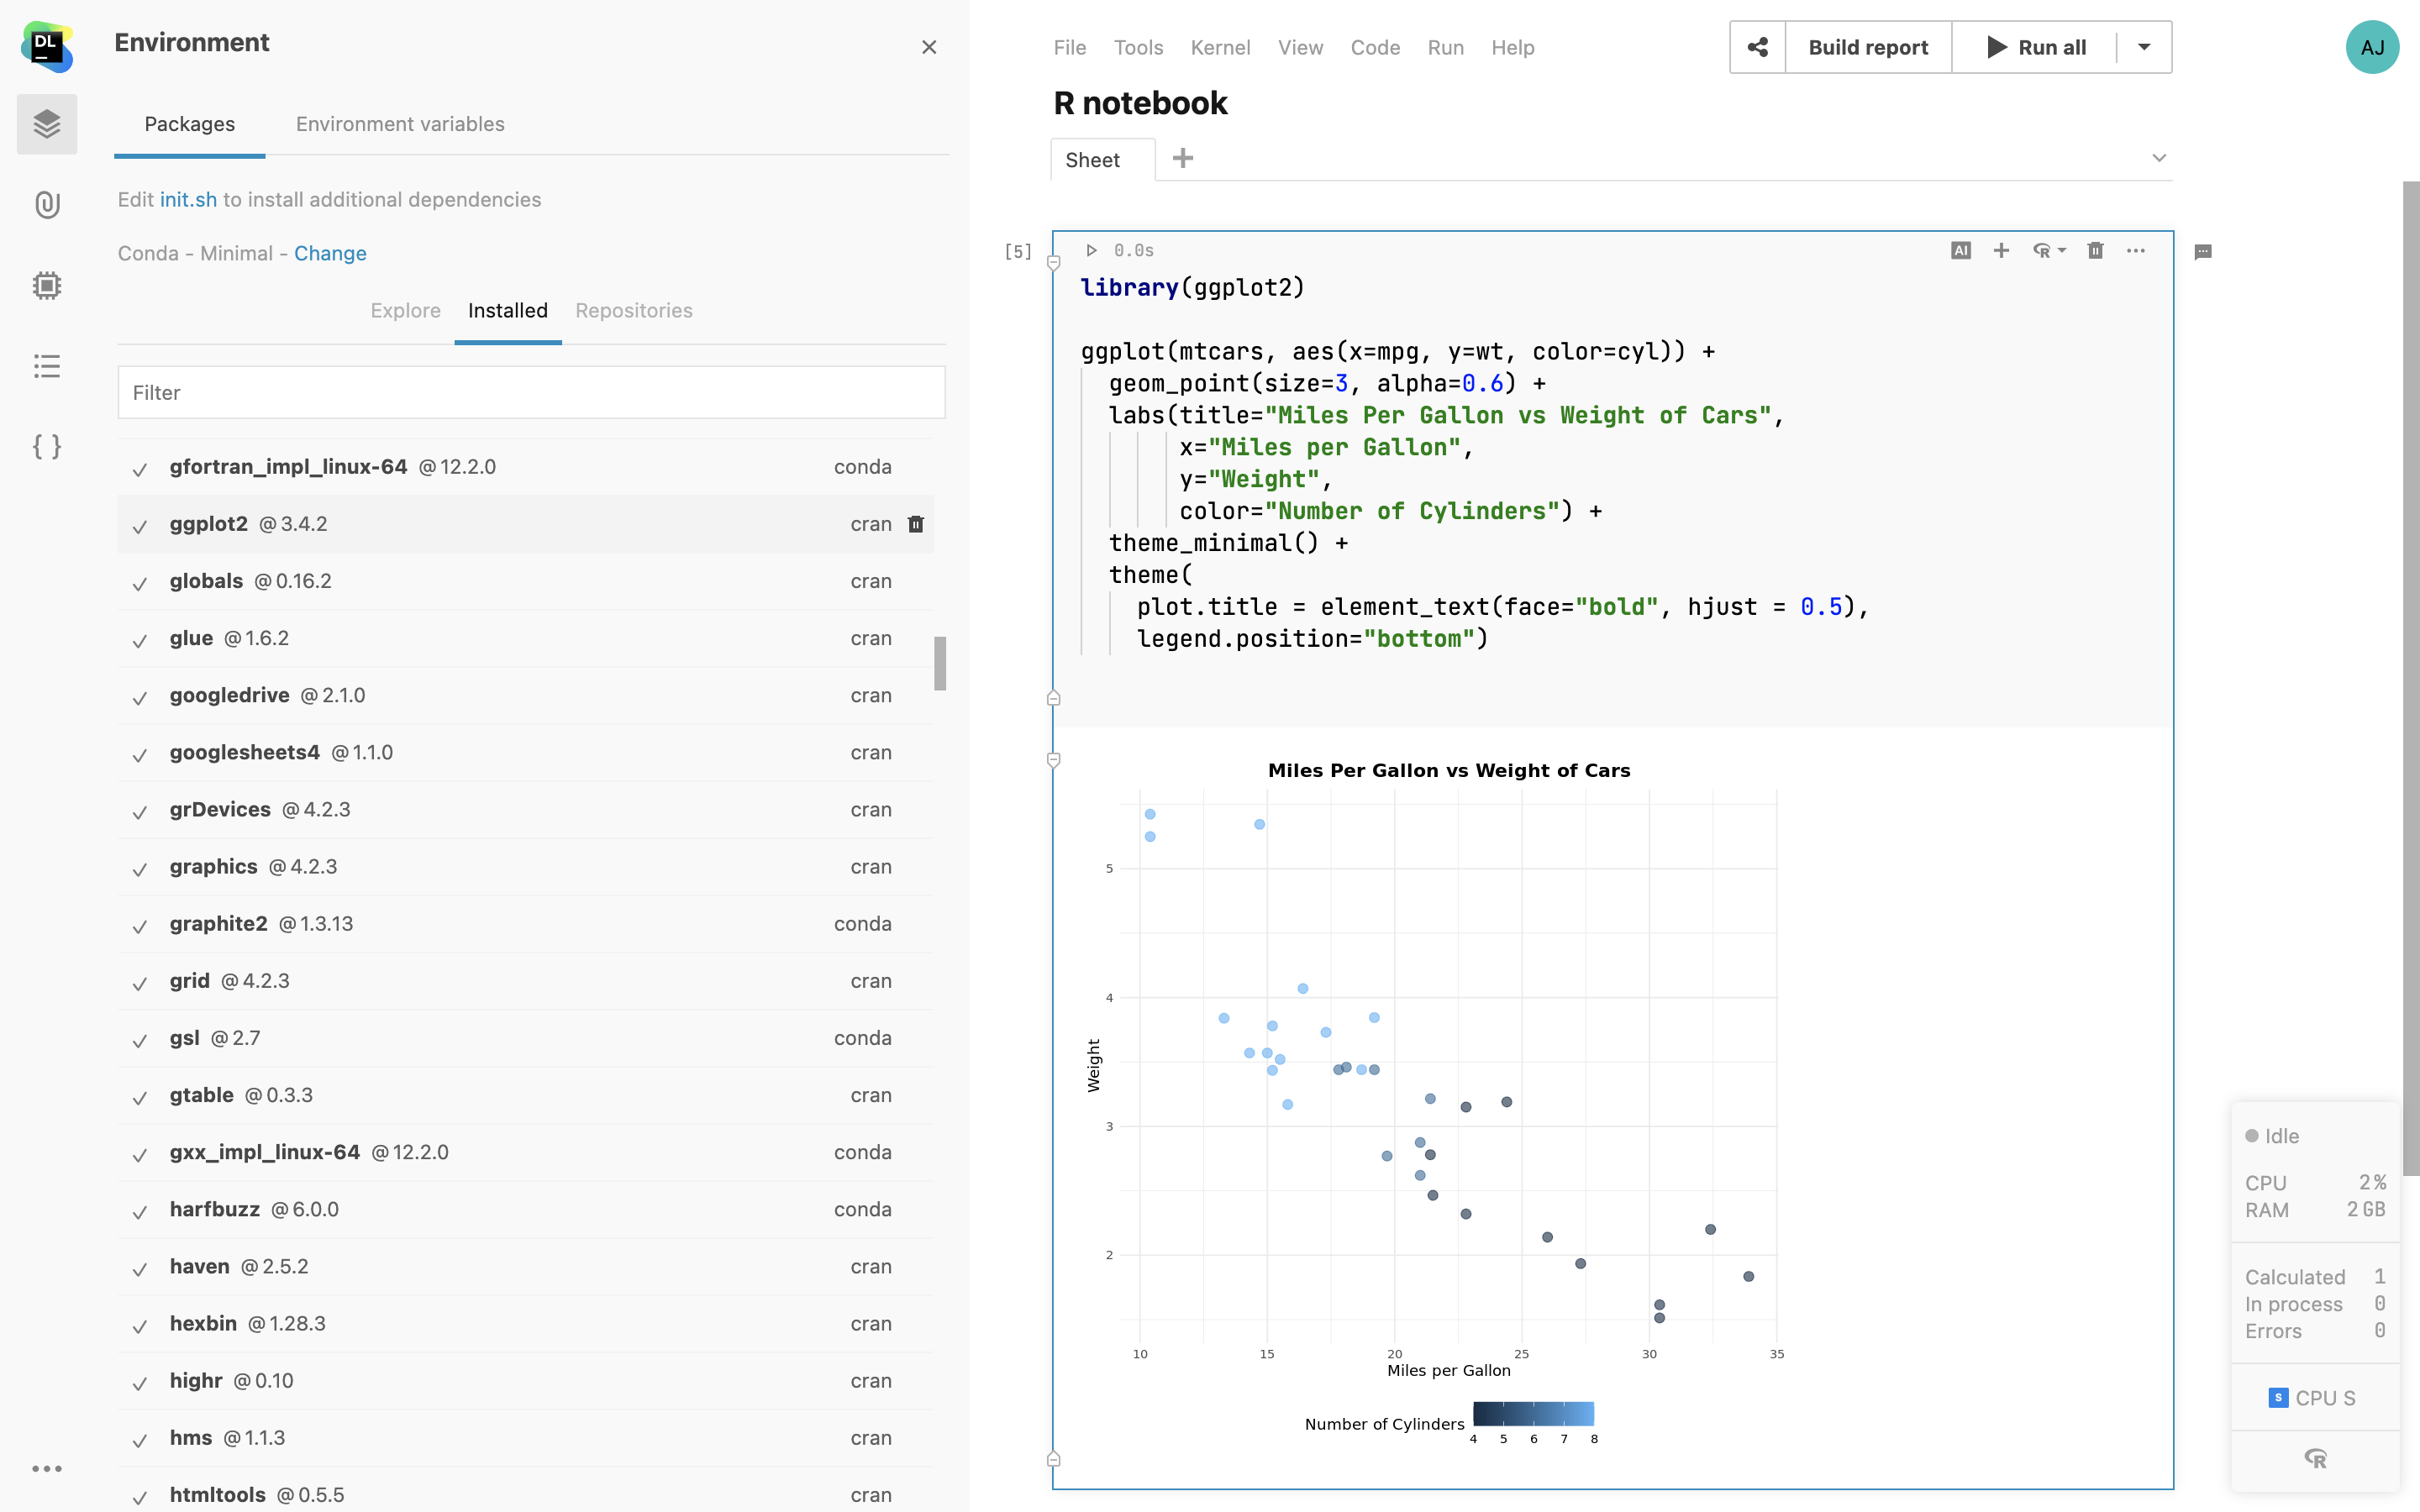
Native R package support
For R notebooks, you can now install packages from public and private R package
repositories supported by install.packages inside the
Environment manager tab. Using Environment manager helps keep your
environment configuration persistent throughout the notebook runs. It's possible
to configure a custom repo by creating an .Rprofile file in init.sh
or a custom agent image.
While the conda installation remains the default in the cloud version, Enterprise customers can configure a non-conda custom base environment with the R kernel. This will lead to an absence of conda packages in the Environment manager search results. You can find an example of such an installation here.

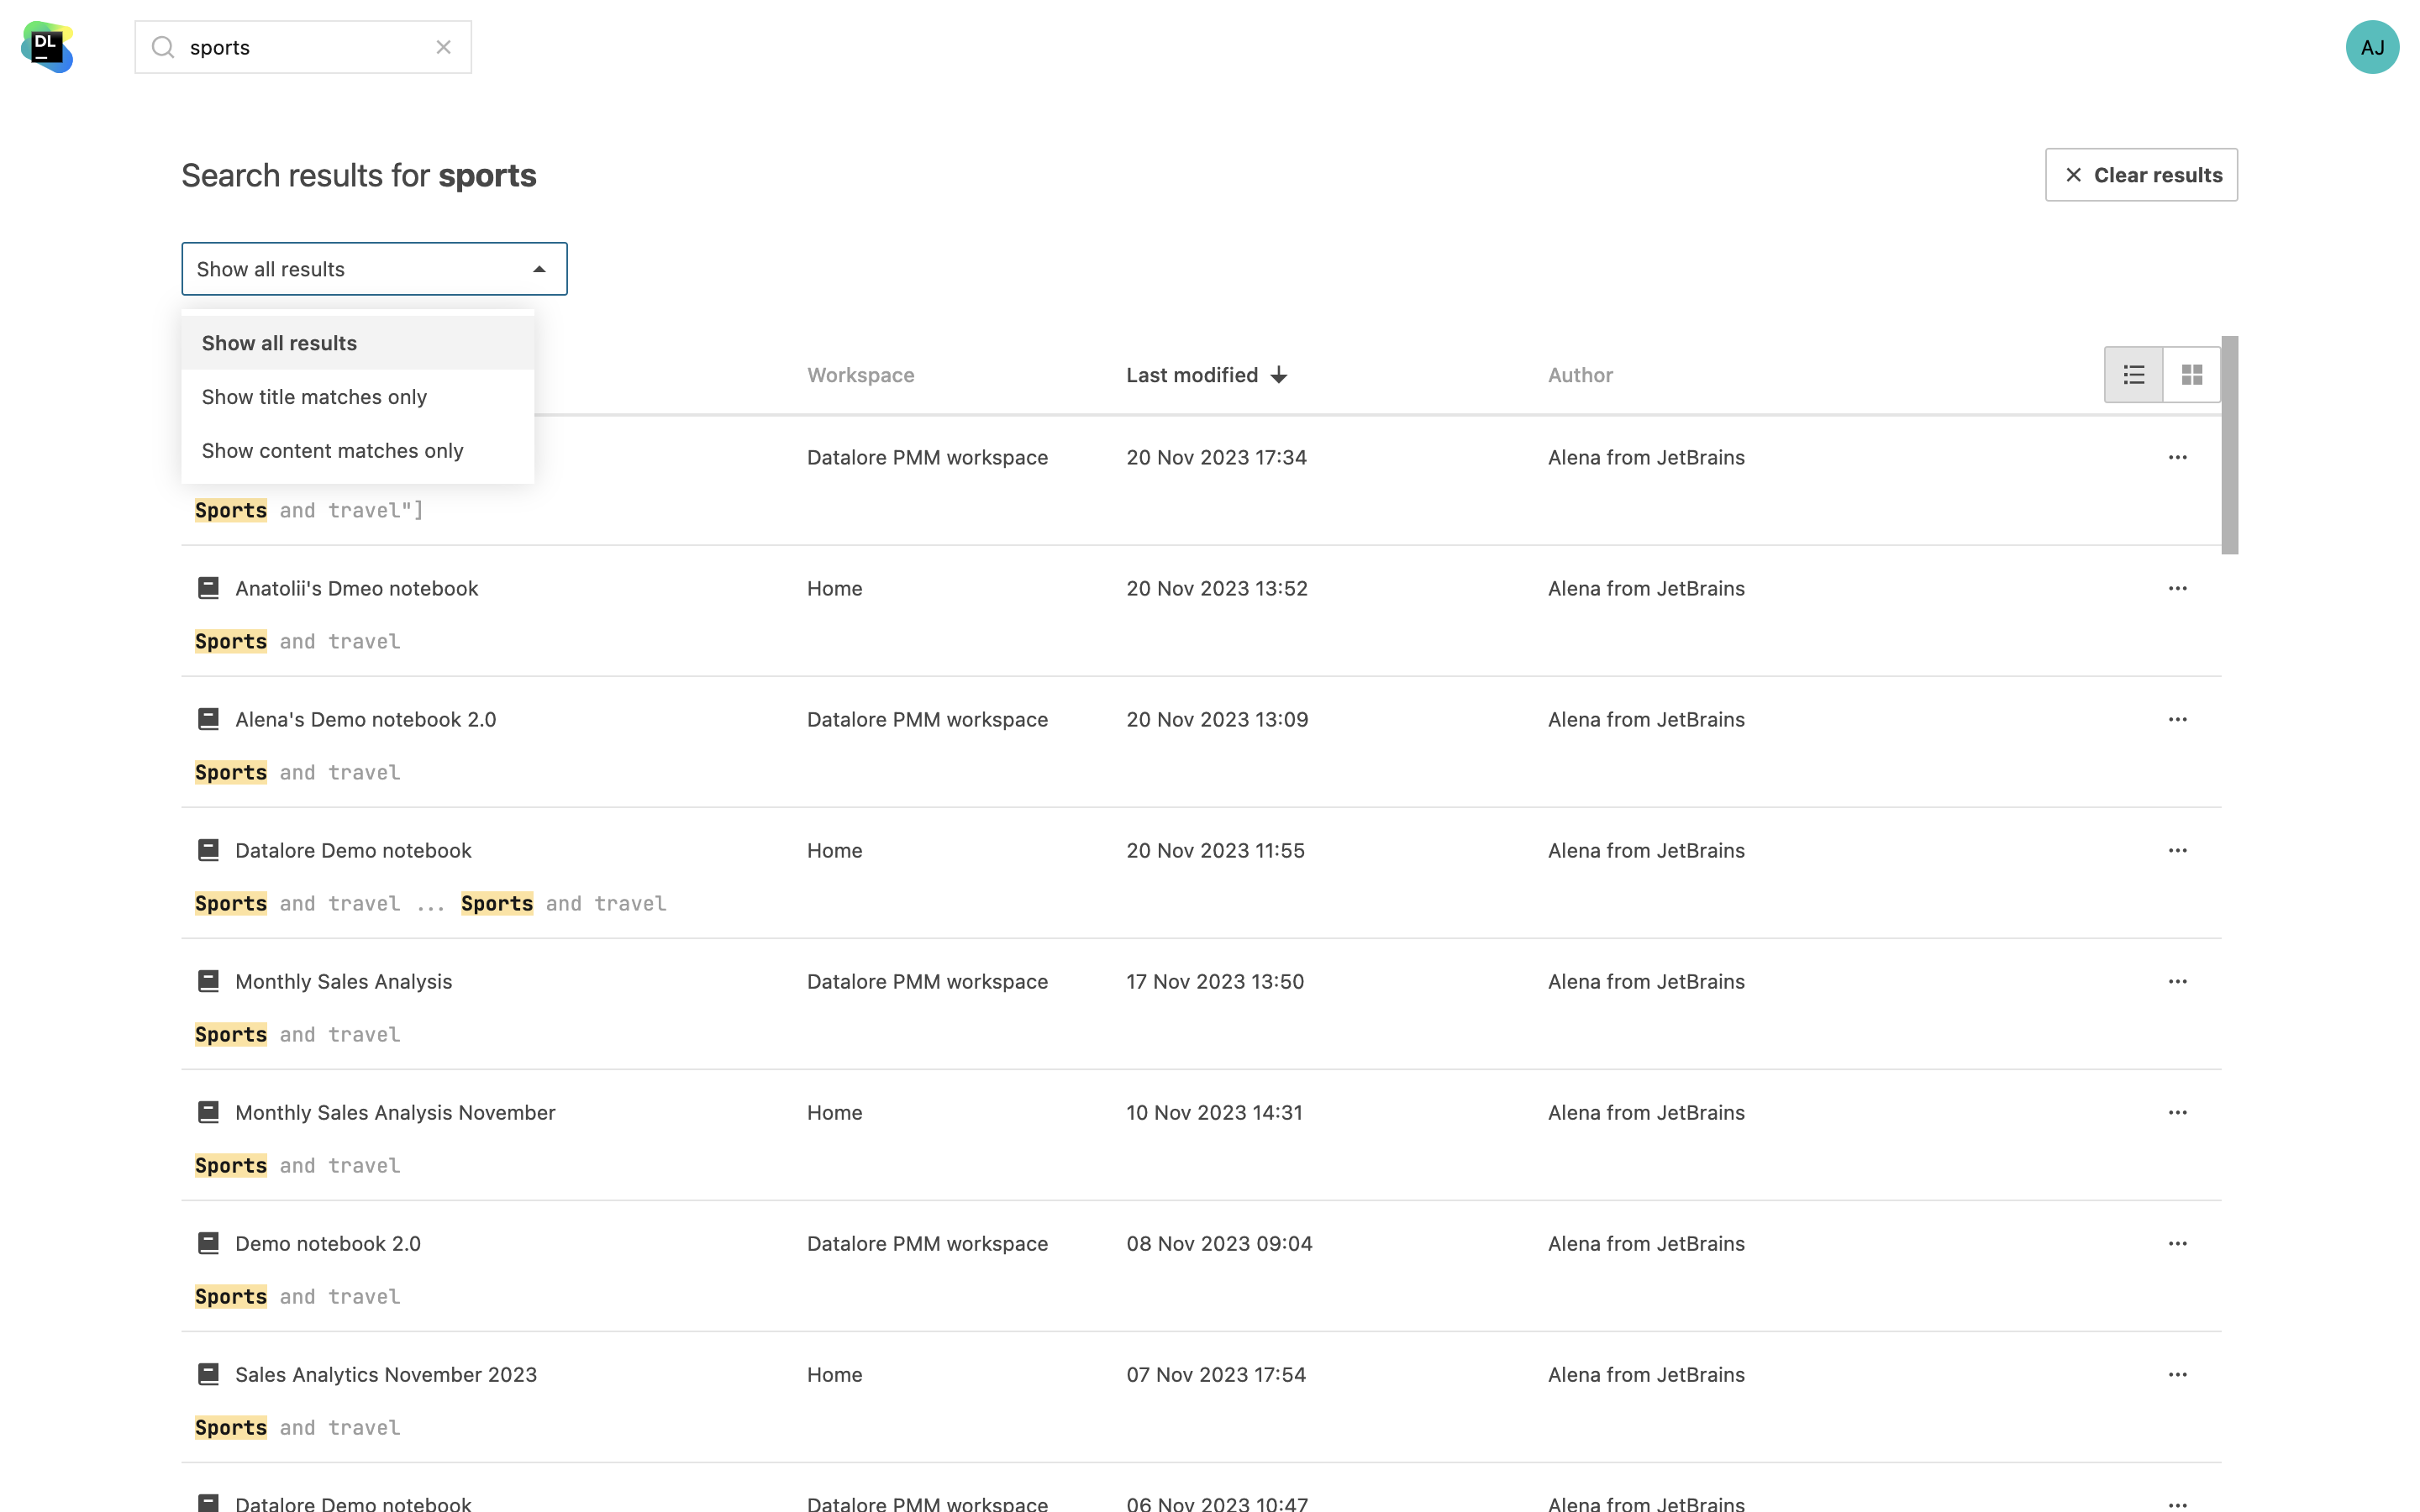
Notebook content search
Locate specific code sections or find the necessary information in all notebooks across your workspaces. In addition to searching for notebook names, you can now search for variable names and content. You will see your query highlighted in the search results.
