Static code analysis
In CLion, there is a set of code inspections that detect and correct abnormal code in your project before you compile it. The IDE can find and highlight various problems, locate dead code, find probable bugs, spelling problems, and improve the overall code structure.
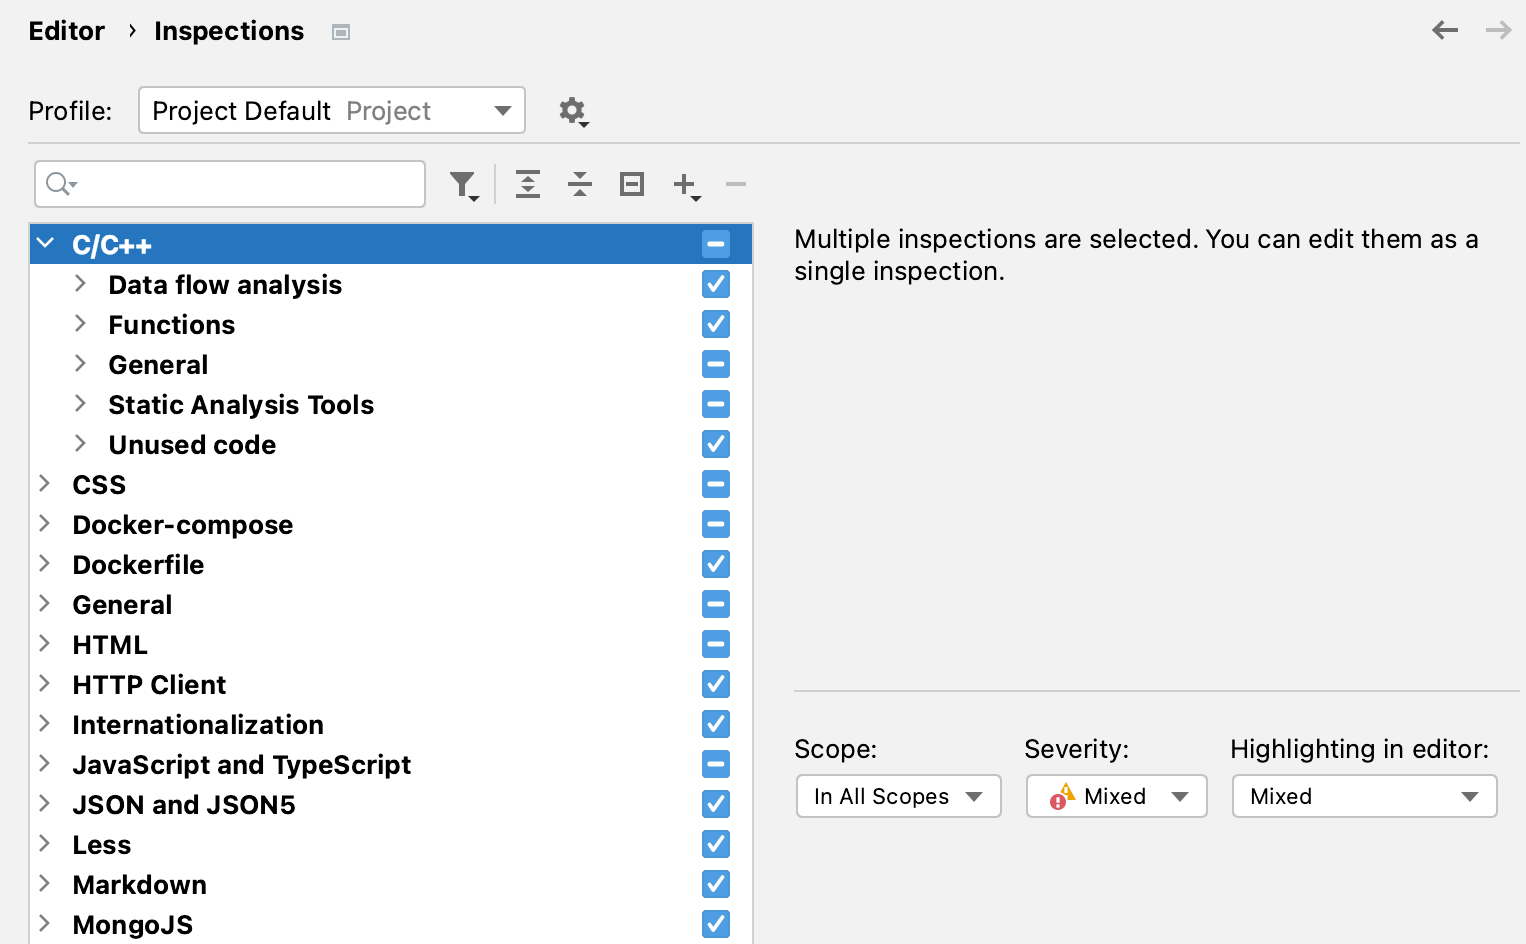
Inspections can scan your code in all project files or only in specific scopes (for example, only in production code or in modified files).
Every inspection has a severity level — the extent to which a problem can affect your code. Severities are highlighted differently in the editor so that you can quickly distinguish between critical problems and less important things. CLion comes with a set of predefined severity levels and enables you to create your own.
Inspections and their settings are grouped in profiles. Each profile contains the information on the enabled inspections, a scope of files that they analyze, and their severity levels.
Access inspections settings
To edit inspections and inspection profiles, do one of the following:
Go to the Editor | Inspections settings page Ctrl+Alt+S

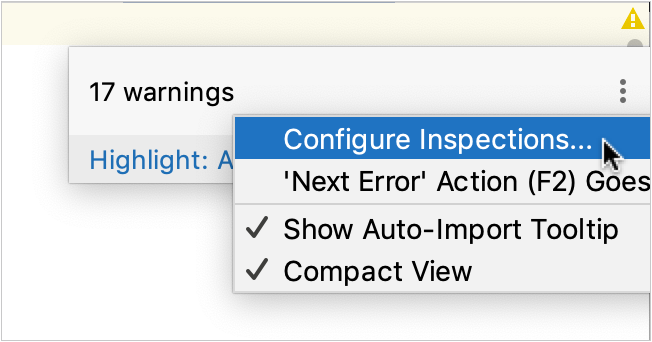
Hover over the inspection widget in top-right corner of the editor, click
, and select Configure Inspections:

In the editor, open the suggestion list, click the right arrow, and choose on the submenu.
In the Problems tool window, click Edit Settings
on the toolbar or use the corresponding context menu command.
Use to filter the inspection list. For example, you can filter inspections by severity or by language.