Disabling and enabling inspections
Some inspections may report problems that you currently do not want to see. In this case, you can disable or suppress them.
When you disable an inspection, you turn it off. It means that the code analysis engine stops searching project files for the problem that this inspection is designed to detect. Note that when you disable an inspection, you disable it in the current inspection profile; it remains enabled in other profiles.
Disable inspections
Disable an inspection in the settings
In the Settings/Preferences dialog (Ctrl+Alt+S), select .
Locate the inspection you want to disable, and clear the checkbox next to it.
Apply the changes and close the dialog.
You can quickly disable a triggered inspection directly in the editor.
Disable an inspection in the editor
Place the caret at the highlighted line and press Alt+Enter (or click
to use the intention action).
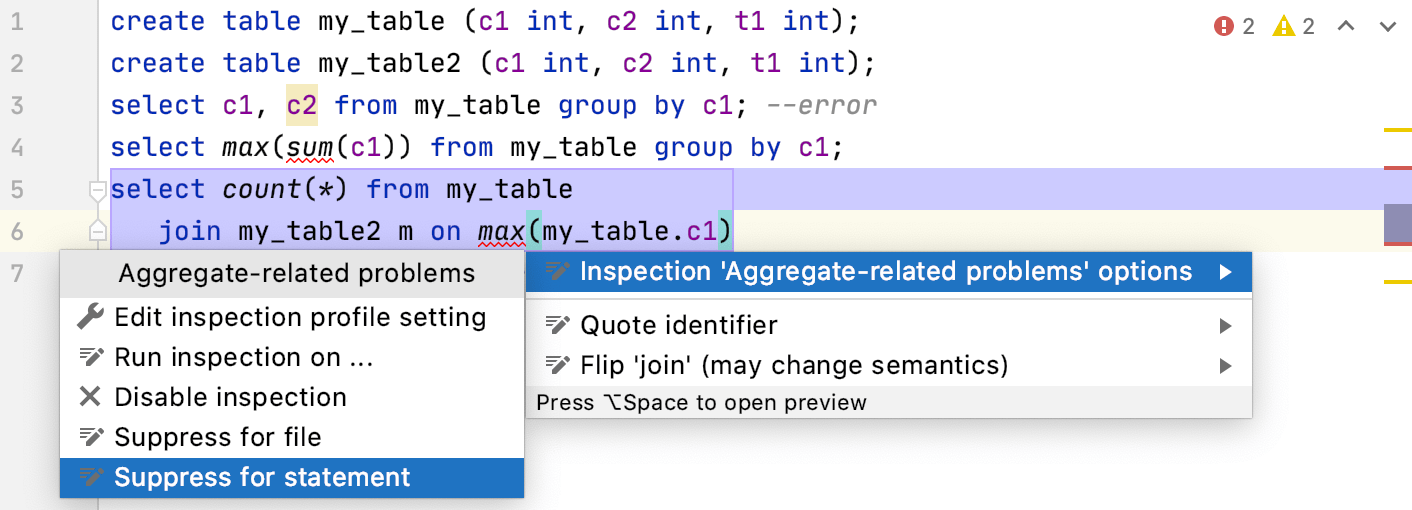
Click the arrow next to the inspection you want to disable, and select Disable inspection.
Disabling inspections in the Problems tool window
In the Inspection Results tool window (after running code analysis), right-click the inspection you want to disable and select Disable inspection.
Click
to hide the disabled inspection alerts.
Suppress inspections
When you suppress an inspection, the code analysis engine doesn't highlight the problem found by this inspection in the specific piece of code (class, method, field, or statement).
Suppress an inspection in the editor
Place the caret at the highlighted line and press Alt+Enter (or click
to use the intention action).
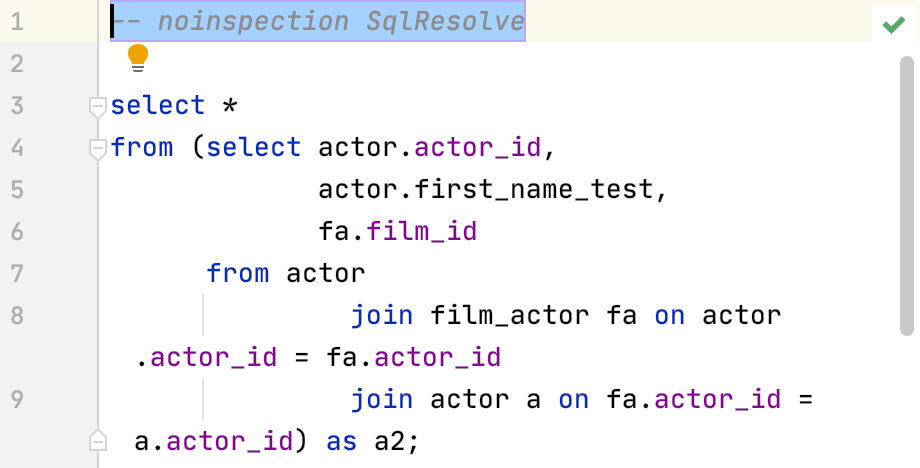
Click the arrow next to the inspection you want to suppress, and select the necessary suppress action. DataGrip adds a
-- noinspectioncomment above the code fragment where the inspection is suppressed.
Suppress an inspection in the Inspection Results tool window
The Inspection Results tool window shows the problems detected while running code analysis.
In the Inspection Results tool window (after running code analysis), right-click the inspection you want to suppress and select the necessary suppress action.

Enable suppressed inspections
When you suppress an inspection, the IDE adds the -- noinspection annotation before the selected symbol. For example, if you suppress an inspection for a statement, DataGrip adds the annotation before this statement.
To re-enable a suppressed inspection, delete the
-- noinspectionannotation.
Change the highlighting level for a file
By default, DataGrip highlights all detected code problems. Hover the mouse over the widget in top-right corner of the editor and select another level from the Highlight list:
None: turn highlighting off.
Syntax: highlight syntax problems only.
All Problems: (default) highlight syntax problems and problems found by inspections.

You can also change the highlighting level from the main menu. Select or press Ctrl+Alt+Shift+H.