Change inspection severity
Inspection severity levels indicate how seriously the detected code problems affect your project. In DataGrip, there is a set of predefined severity levels:
Error
: syntax errors.
Warning
: code fragments that might produce bugs or require enhancement.
Weak Warning
 : code fragments that can be improved or optimized (redundant code, duplicated code fragments, and so on).
Server Problem
 : problems that come from an external build server, for example, from TeamCity.
Grammar Error
: grammar mistakes. This severity comes from the bundled Grazie plugin.
Typo
: spelling mistakes and typos.
Consideration: code fragments that can be improved. This severity is not marked on the error stripe and does not have a default highlighting style, but you can choose one from the list of existing styles or configure your own.
No highlighting (fix available): provides no code highlighting; the list of available fixes is invoked by pressing Alt+Enter.
For every severity, you can configure its own highlighting style in the editor.
Severity levels are designed to indicate problems, they don't have any impact on the code execution: if you change the severity for spelling mistakes from Typo to Error, this won't affect the execution of your application.
Change inspection severity in all scopes
Press Control+Alt+S to open the IDE settings and select .
Select the profile that you want to modify and then choose an inspection from the list. Make sure that it is enabled.
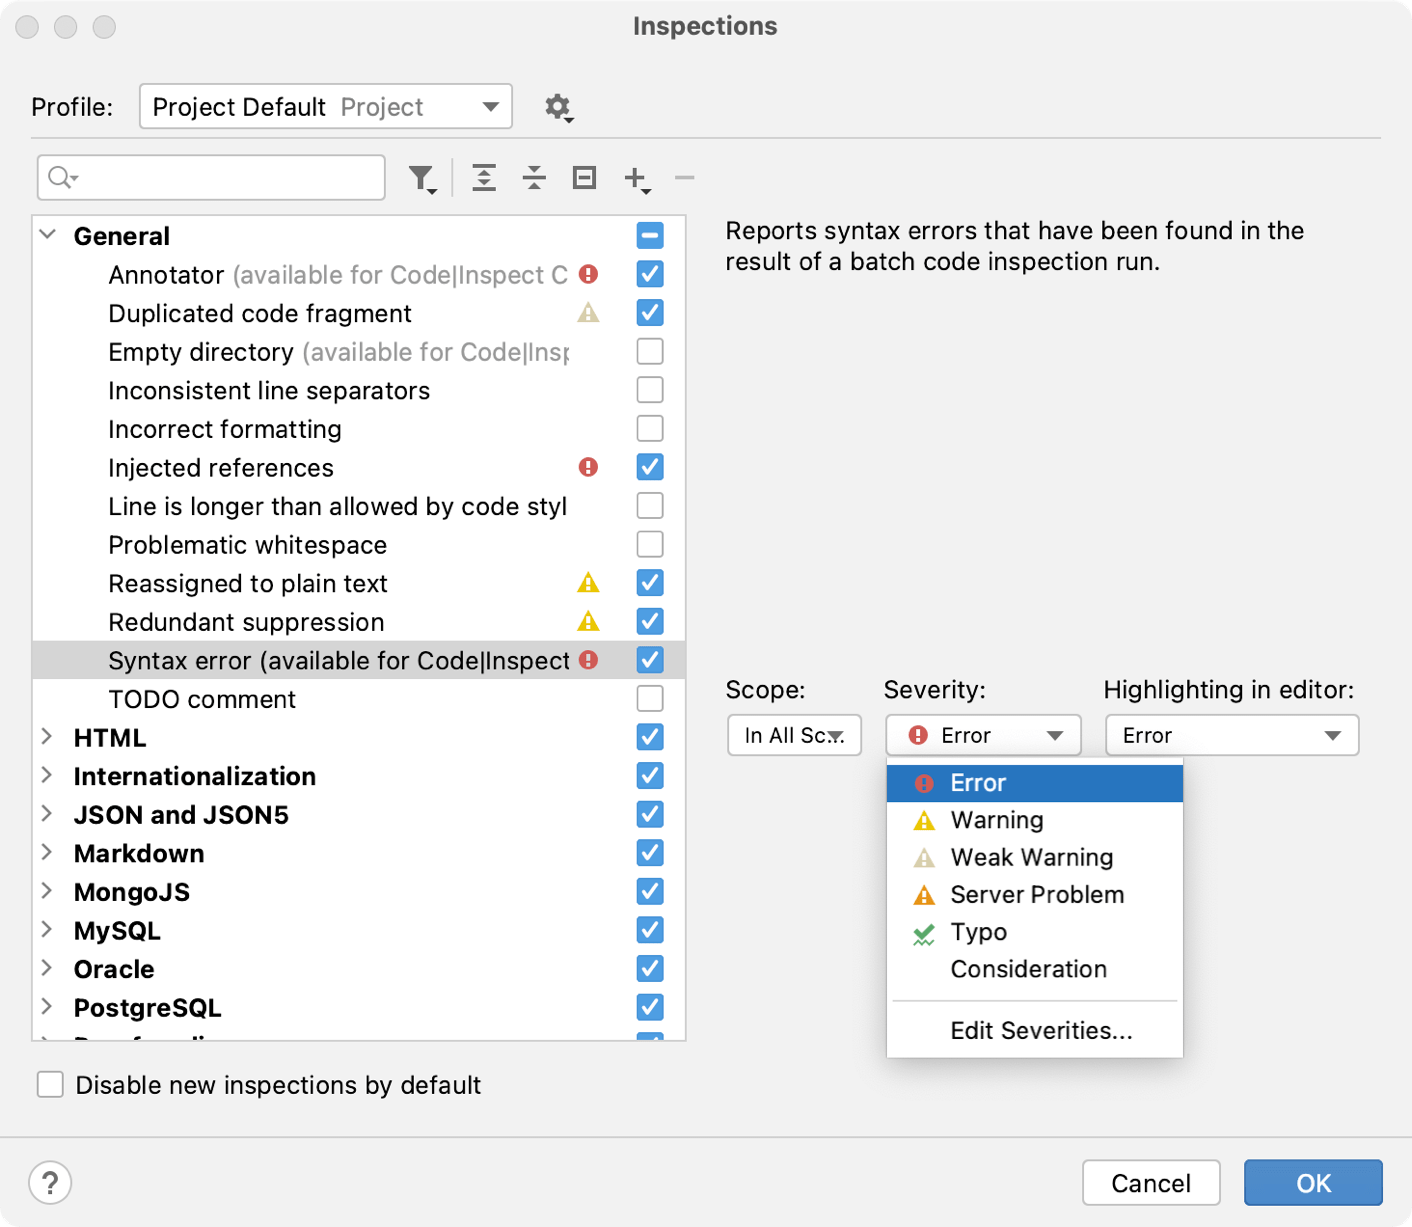
From the Severity list, select a new severity level. You can also right-click the inspection and select the severity level from the context menu.
If the necessary severity is not on the list, click Edit Severities to create a new one.
From the Highlighting in editor list, select the style that you want to use to highlight code fragments in the editor.
Select Edit Highlighting to modify the existing styles.

Apply the changes and close the dialog. The modified inspection will now have the new severity level in the selected profile.
Change inspection severity in specific scopes
Press Control+Alt+S to open the IDE settings and select .
Select the profile that you want to modify and then choose an inspection from the list. Make sure that it is enabled.
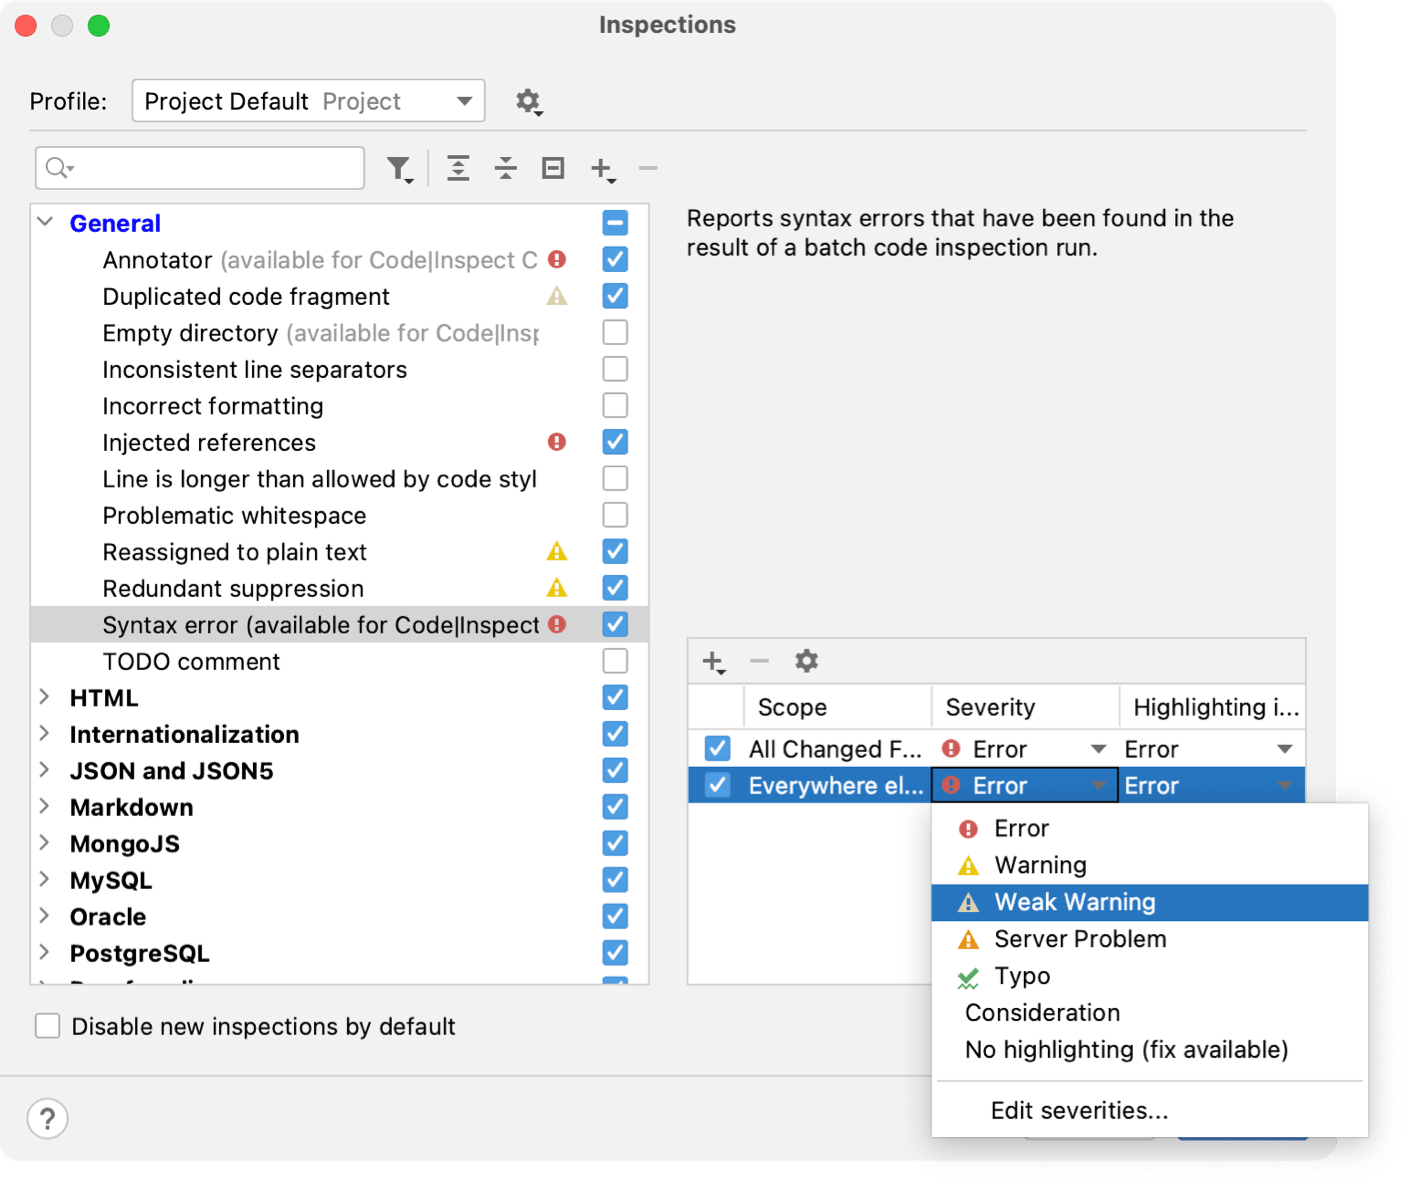
From the In All Scopes list, select the scope for which you want to change the severity.
DataGrip shows severities for two scopes: the selected one and Everywhere else.
To add one more scope, click
. If you want to create a new scope, select Edit Scopes Order from the list of scopes and click
.
Select the necessary severity level from the Severity list.
If the necessary severity is not on the list, click Edit Severities to create a new one.

Additionally, from the Highlighting in editor list, select the style that you want to use to highlight code fragments in the editor.
Select Edit Highlighting to modify the existing styles.
If you enable an inspection in multiple scopes, and files in these scopes match, the IDE will process these scopes according to their order in the list. For more information, refer to Change the order of scopes.
Configure error highlighting
Press Control+Alt+S to open the IDE settings and select .
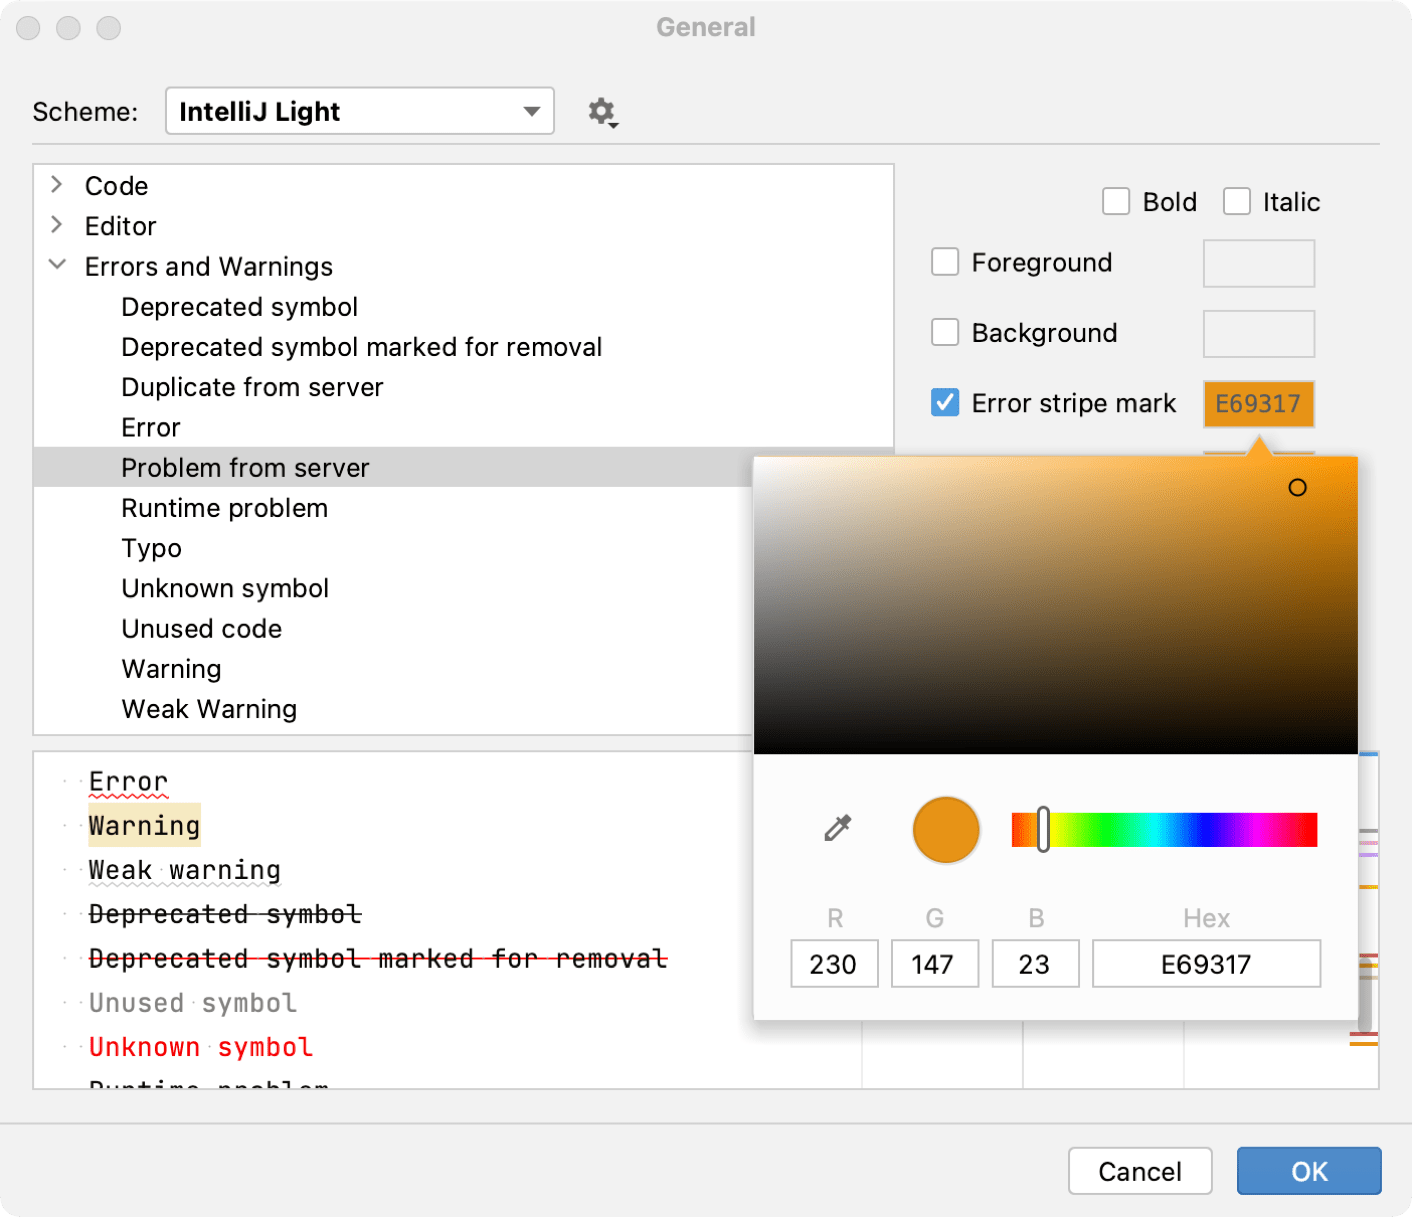
You can also configure highlighting from inspection settings: go to , click any enabled inspection, and from the Highlighting in editor list, select Edit Highlighting.
From the Errors and Warnings list, select the style that you want to modify.
Configure the new highlighting rules using the options on the right. To preview the changes before applying them, use the preview section at the bottom of the dialog.

Create a new severity level
Press Control+Alt+S to open the IDE settings and select .
Select the profile in which you want to create a new severity level.
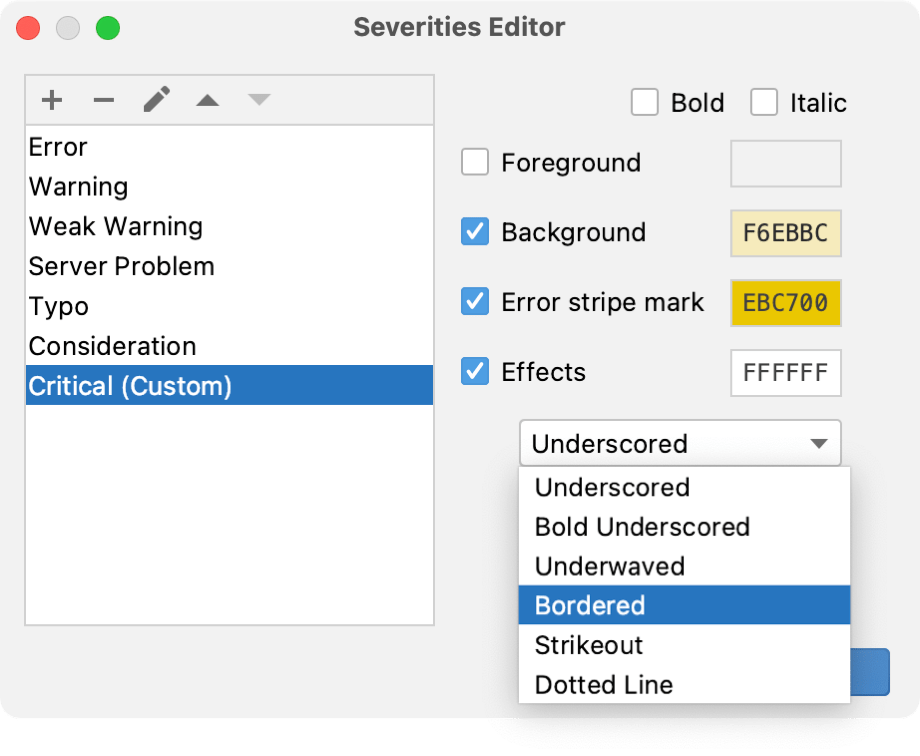
Click any inspection and select Edit severities from the list of severity levels.
In the Severities Editor dialog, click
and name the new severity level.
Configure the formatting and set a priority using the
and
buttons — the higher you put the severity on the list, the higher its priority.
Click OK when finished.
