High memory consumption
The Java Virtual Machine (JVM) running DataGrip allocates some predefined amount of memory. The default value depends on the platform. If you are experiencing slowdowns, you may want to increase the memory heap.
Go to Help | Change Memory Settings.
Set the necessary amount of memory that you want to allocate and click Save and Restart.
This action changes the value of the -Xmx option used by the JVM to run DataGrip. Restart DataGrip for the new setting to take effect.
tip
The Change Memory Settings action is available starting from DataGrip version 2019.2. For previous versions or if the IDE crashes, you can change the value of the
-Xmxoption manually as described in JVM options.
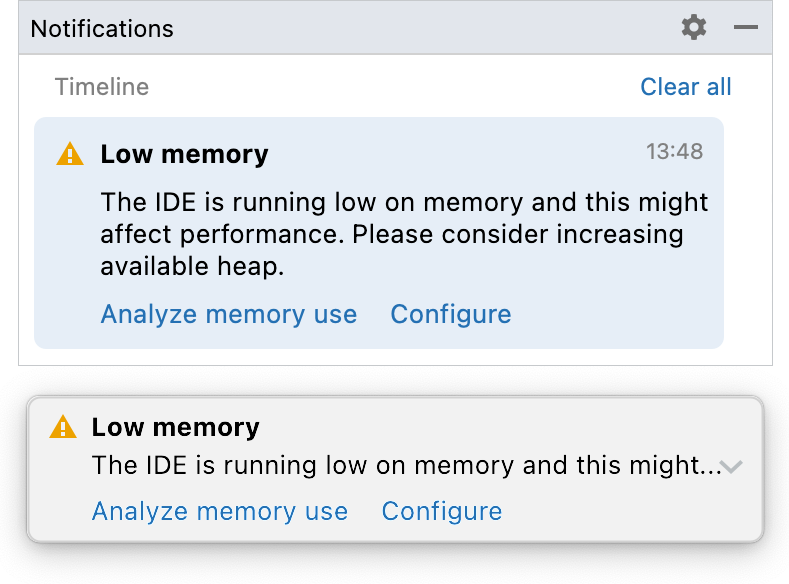
DataGrip also warns you if the amount of free heap memory after a garbage collection is less than 5% of the maximum heap size:

Click Configure to increase the amount of memory allocated by the JVM. If you are not sure what would be a good value, use the one suggested by DataGrip.

Click Save and Restart and wait for DataGrip to restart with the new memory heap setting.
If these settings do not fix the problem, capture a memory snapshot, and send it to the JetBrains support team.
Click Help | Diagnostic Tools | Capture Memory Snapshot.
Alternatively, press CtrlShift0A, type
capture memory, and select Capture Memory Snapshot.Wait until the HPROF snapshot is built. You can navigate to it from the notification balloon.
 Gif
Gif
You can capture memory snapshots automatically when the IDE runs out of memory.
Click Help | Edit Custom VM Options.
In the VMOPTIONS file, add the following lines:
-XX:+HeapDumpOnOutOfMemoryError
                -XX:HeapDumpPath=$USER_HOME/java_error_in_datagrip.hprof
According to the
HeapDumpPathparameter, the HPROF file will be created in the user directory. Alternatively, specify any other directory that has read-write access.
Thanks for your feedback!