Examine suspended program
After the debugger session has started, the Debug tool window appears, and the program runs normally until one of the following happens:
a breakpoint is hit
you manually pause the program
After that, the program is suspended, allowing you to examine its current state, control its further execution, and test various scenarios at runtime.
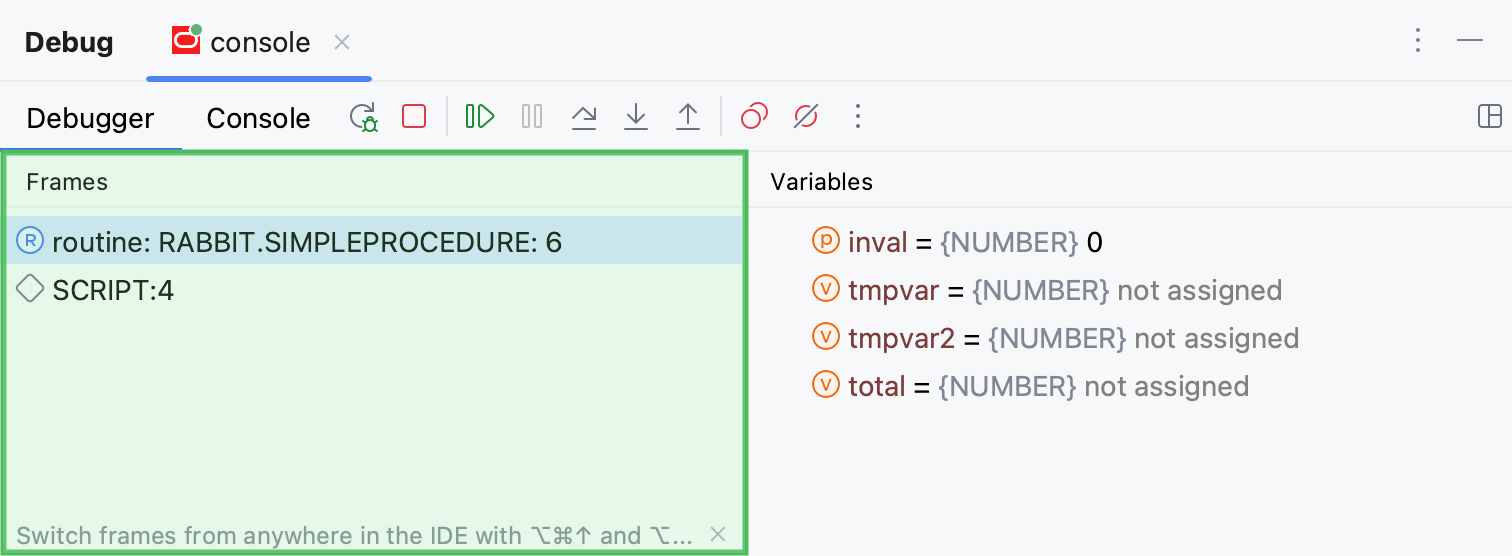
Examine frames
The state of the program is represented by frames. When the program is suspended, the current frame stack is displayed on the Frames tab of the Debug tool window.

Examining frames helps you understand why particular parameters were passed to a PL/SQL object and what the state of the caller was at the time of calling.
Copy stack to clipboard
To copy the call stack , right-click anywhere on the Frames tab and select Copy Stack.
Evaluate expressions
DataGrip lets you evaluate expressions during a debugging session to obtain additional details about the program state or test various execution scenarios at runtime.
This feature only works if the program was suspended after hitting a breakpoint (not ).
If there are breakpoints inside methods called within the expression, they will be ignored.
Evaluate a simple expression in the editor
To quickly evaluate an expression, point at it in the editor. Note that method calls cannot be evaluated this way.
Point at the expression you want to evaluate. The result of the expression appears in a tooltip.
To view child elements of the resulting object, click
or press Ctrl+F1.
If you find value tooltips distracting, you can increase the delay or disable them altogether. To do this, in the Settings dialog (Ctrl+Alt+S) , go to and set the Show value tooltip and Value tooltip delay options according to your preference.
Watches
If you want to keep track of some variable or the result of a more complex expression, set up a watch for this variable or expression. This is useful when you need to evaluate something that is not regularly displayed on the list of variables, or to pin some instance variable thus eliminating the need to expand the tree after each step.
Watches are evaluated in the context of the selected frame. Watches cannot be evaluated when they are out of context or when they fail to compile. If this is the case, the watch is marked with the error icon .
By default, watches are shown together with variables in the Variables pane. To hide/reveal the Watches pane, use the Separate watches option in the Layout Settings menu.
Add a watch
Click New Watch
on the Variables tab.
Enter the variable or expression to be evaluated. In expressions, you can evaluate method calls, lambdas declare variables, and so on, as long as this is in the local context.
After you have added a variable/expression to Watches, it stays there and is evaluated for each step, providing you with the result in the current context.
Edit a watch
Right-click the desired watch and select Edit.
Copy a watch
Select the watch you want to copy.
Click Duplicate Watch
on the Variables/ Watches tab or press Ctrl+D.
Change the order of watches
For convenience, you can change the order in which the watches appear on the Variables/ Watches pane.
Use the Move Watch Up/Move Watch Down buttons on the Variables/ Watches pane or Ctrl+Up and Ctrl+Down keyboard shortcuts.
Delete a watch
To remove a single watch, right-click it and select Remove Watch. Alternatively, select the watch and press Delete on the Variables/ Watches pane.
To remove all watches, right-click anywhere on the Variables/ Watches pane and select Remove All Watches.
Watches allow for the same actions as variables do. For example, you can view them in a dedicated dialog.
Watches are a part of your project. This means you can stop and rerun the debugging session without risk of losing them.
Execution point
Return to the current execution point
Examining the program state involves navigating in code, and you often need to return to the place where your program is suspended.
Do one of the following:
In the main menu, go to .
Press Alt+F10.
Click
on the stepping toolbar of the Debug tool window.
The current execution point is indicated with a blue line. The code at this line has not been executed yet.