Code reference information
Parameter info
The Parameter Info popup shows the names of parameters in method and function calls. DataGrip automatically shows a popup with all available method signatures within 1 second (1000 milliseconds) after you type an opening bracket in the editor, or select a method from the suggestion list.
You can explicitly invoke the popup if it has closed or if your IDE is configured not to show the popup automatically. To do so, press Ctrl+P (or click ).

Configure the parameter info popup
In the Settings dialog (Ctrl+Alt+S) , go to .
In the Show the parameter info popup in ... milliseconds field, specify the time in milliseconds after which the popup should appear.
If you don't want the popup to appear automatically, clear the Show the parameter info popup in ... milliseconds checkbox.
Inlay hints
Inlay hints are special markers that appear in the editor and provide you with additional information about your code, like the names of the parameters that a called method expects. Other types of hints inform you about annotations, method parameters, usages, and so on (depending on the language).

Some of the hints are enabled by default.
You can fine-tune inlay hints in .
Configure the parameter hints exception list
You can configure the list with exceptions for parameter hints.
In the Settings dialog (Ctrl+Alt+S) , select and click the necessary language.
Select Parameter hints in the list in the middle section.
The options for configuring hints become available on the right.
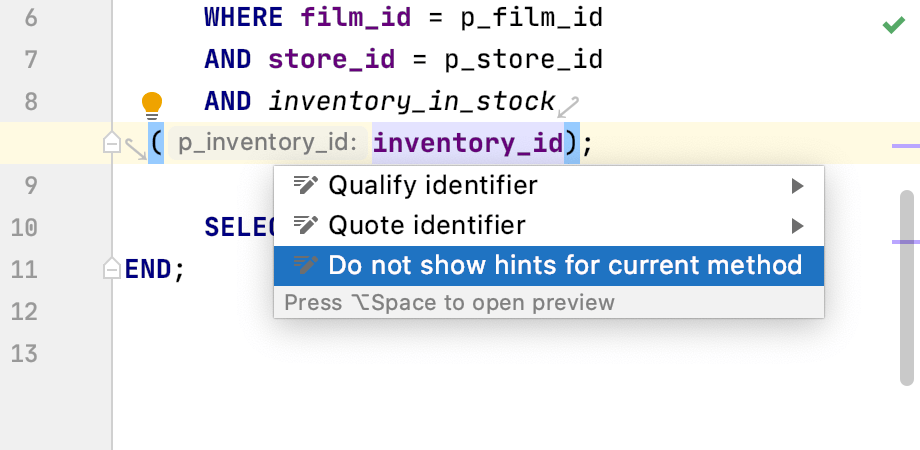
Add cases for which you do not want to see the hints to the Exclude list section. To add a case, click the inline hint in your code, press Alt+Enter and select Do not show hints for current method.
Apply the changes and close the dialog.

Quick Documentation
You can get quick information for any symbol right from the editor with the Quick Documentation feature. It shows you code documentation in a popup as you hover over code elements.
Quick Documentation in a popup
View Quick Documentation in a popup
Hover over the necessary symbol in the editor.
Place the caret at the symbol and press Ctrl+Q ().
Press Ctrl+Q again to open this documentation in the Documentation tool window.
Click in the popup to change the font size, display the quick documentation toolbar, or go to the source code.
Disable Quick Documentation on hover
By default, the quick documentation popup appears as you hover over code elements. You can configure the IDE to display the popup only after you explicitly invoke the Quick Documentation feature.
Click
in the popup and disable the Show on Mouse Move option.
In the Settings dialog (Ctrl+Alt+S) , go to and clear the Show quick documentation on hover checkbox.
In this case, to view documentation for a symbol at caret, press Ctrl+Q or select from the main menu. The documentation will be shown in a popup, but you can configure the IDE to display it in the tool window right away.
Quick Documentation in the tool window
View documentation in the tool window
With the default settings, pressing Ctrl+Q () opens quick documentation in a popup. You can change the settings to view documentation in the tool window.
In the quick documentation popup, click
and disable the Show Documentation Popup First option.
In the Documentation tool window, click the
icon on the tool window toolbar and disable the Show Documentation Popup First option.
Keep documentation in the tool window
You can open a piece of documentation for a specific code element in the tool window and keep viewing documentation for other elements in your current file.
Place the caret at the required code element and press Ctrl+Q. If the popup appears, press Ctrl+Q again to switch to the tool window.
The asterisk symbol (
*) on the documentation tab means that the tab is not pinned, so its content will be replaced by documentation for another code element that you select in the editor.Right-click the tab with the documentation in the documentation tool window and enable the Keep This Documentation option.
After that, the current documentation tab will be pinned. You can return to the editor and view documentation for other code elements that will open either in the popup or in a new tab in the tool window.
When you are viewing code documentation in the tool window, it is displayed on the unpinned tab (the tab marked with the asterisk symbol (*). There are several ways in which you can work with it:
You can view documentation by hovering over code elements.
Click the icon on the tool window toolbar and enable the Show on Mouse Move and Auto-Update from Source options.
You can view documentation as you place the caret at symbols in the editor either by clicking them or by moving the caret.
Click the icon on the toolbar, disable the Show on Mouse Move and enable the Auto-Update from Source options.
You can view documentation by placing the caret at a symbol and pressing Ctrl+Q or selecting from the main menu.
Click the icon on the tool window toolbar, disable the Show on Mouse Move and Auto-Update from Source options.
Type Info
In DataGrip, you can identify the type of an expression in the following way:
Place the caret at the necessary code element and press Ctrl+Shift+P (or select from the main menu).
Productivity tips
- Copy tooltip text to the clipboard
To copy tooltip text to the clipboard, hold Alt (on Linux, hold Ctrl+Alt) and click the tooltip.