Interactive reports
You can publish notebooks as an interactive report with a shareable link. This allows you and other users to view the notebook output as a completed HTML page and edit the published notebook's copy collaboratively. Compared to static reports, interactive reports allow viewers to dynamically change data presentations (tables and charts) using interactive controls.
Publish an interactive report
Open the notebook in the editor.
Open the Report builder in one of the two ways:
Click the Build report button in the upper right corner of the editor screen.
Select
Do one of the following:
Publish a report using the original structure of the notebook
Prepare a report using the Report builder before publishing
Refer to the Build and publish reports topic for more details about the tool.
The newly published notebook is added to the Reports list on the Home page or your respective own workspace.
Manage published interactive reports
After you publish an interactive report, you have the following options to manage it:
Update a report after editing the respective notebook, editing the report itself, or changing the publishing settings. For all these cases, open the Report builder and click the Update report in the lower left corner. For more details about changing publishing settings, refer to Build and publish reports.
Manage published interactive reports from your Home page or other workspaces:
Select Reports to view all your published reports.
Click the ellipsis for the interactive report that you want to manage.
Select the following actions from the context menu:
Open: to open the report
Share: to open the sharing dialog and revoke access to the report or copy the link to its page
Edit copy: to open a copy of the respective notebook in the editor
Download: to download the respective notebook as an .ipynb file
Remove: to unpublish the report (without deleting the respective notebook)
View an interactive report
Open a report:
If you're an invited collaborator, click the link in the invitation email.
If you're the report owner, you can use the link right after publishing the report or open the report from Reports on the Home page.
After you open the report, expand the table of contents (if generated in the original notebook) on the right side of the screen.

Work with interactive reports
As a collaborator with access to an interactive report, you can view the report and dynamically change the respective data presentations. Report owners can also edit original notebook code, while all viewers can edit code in their individual copies of the original notebook.
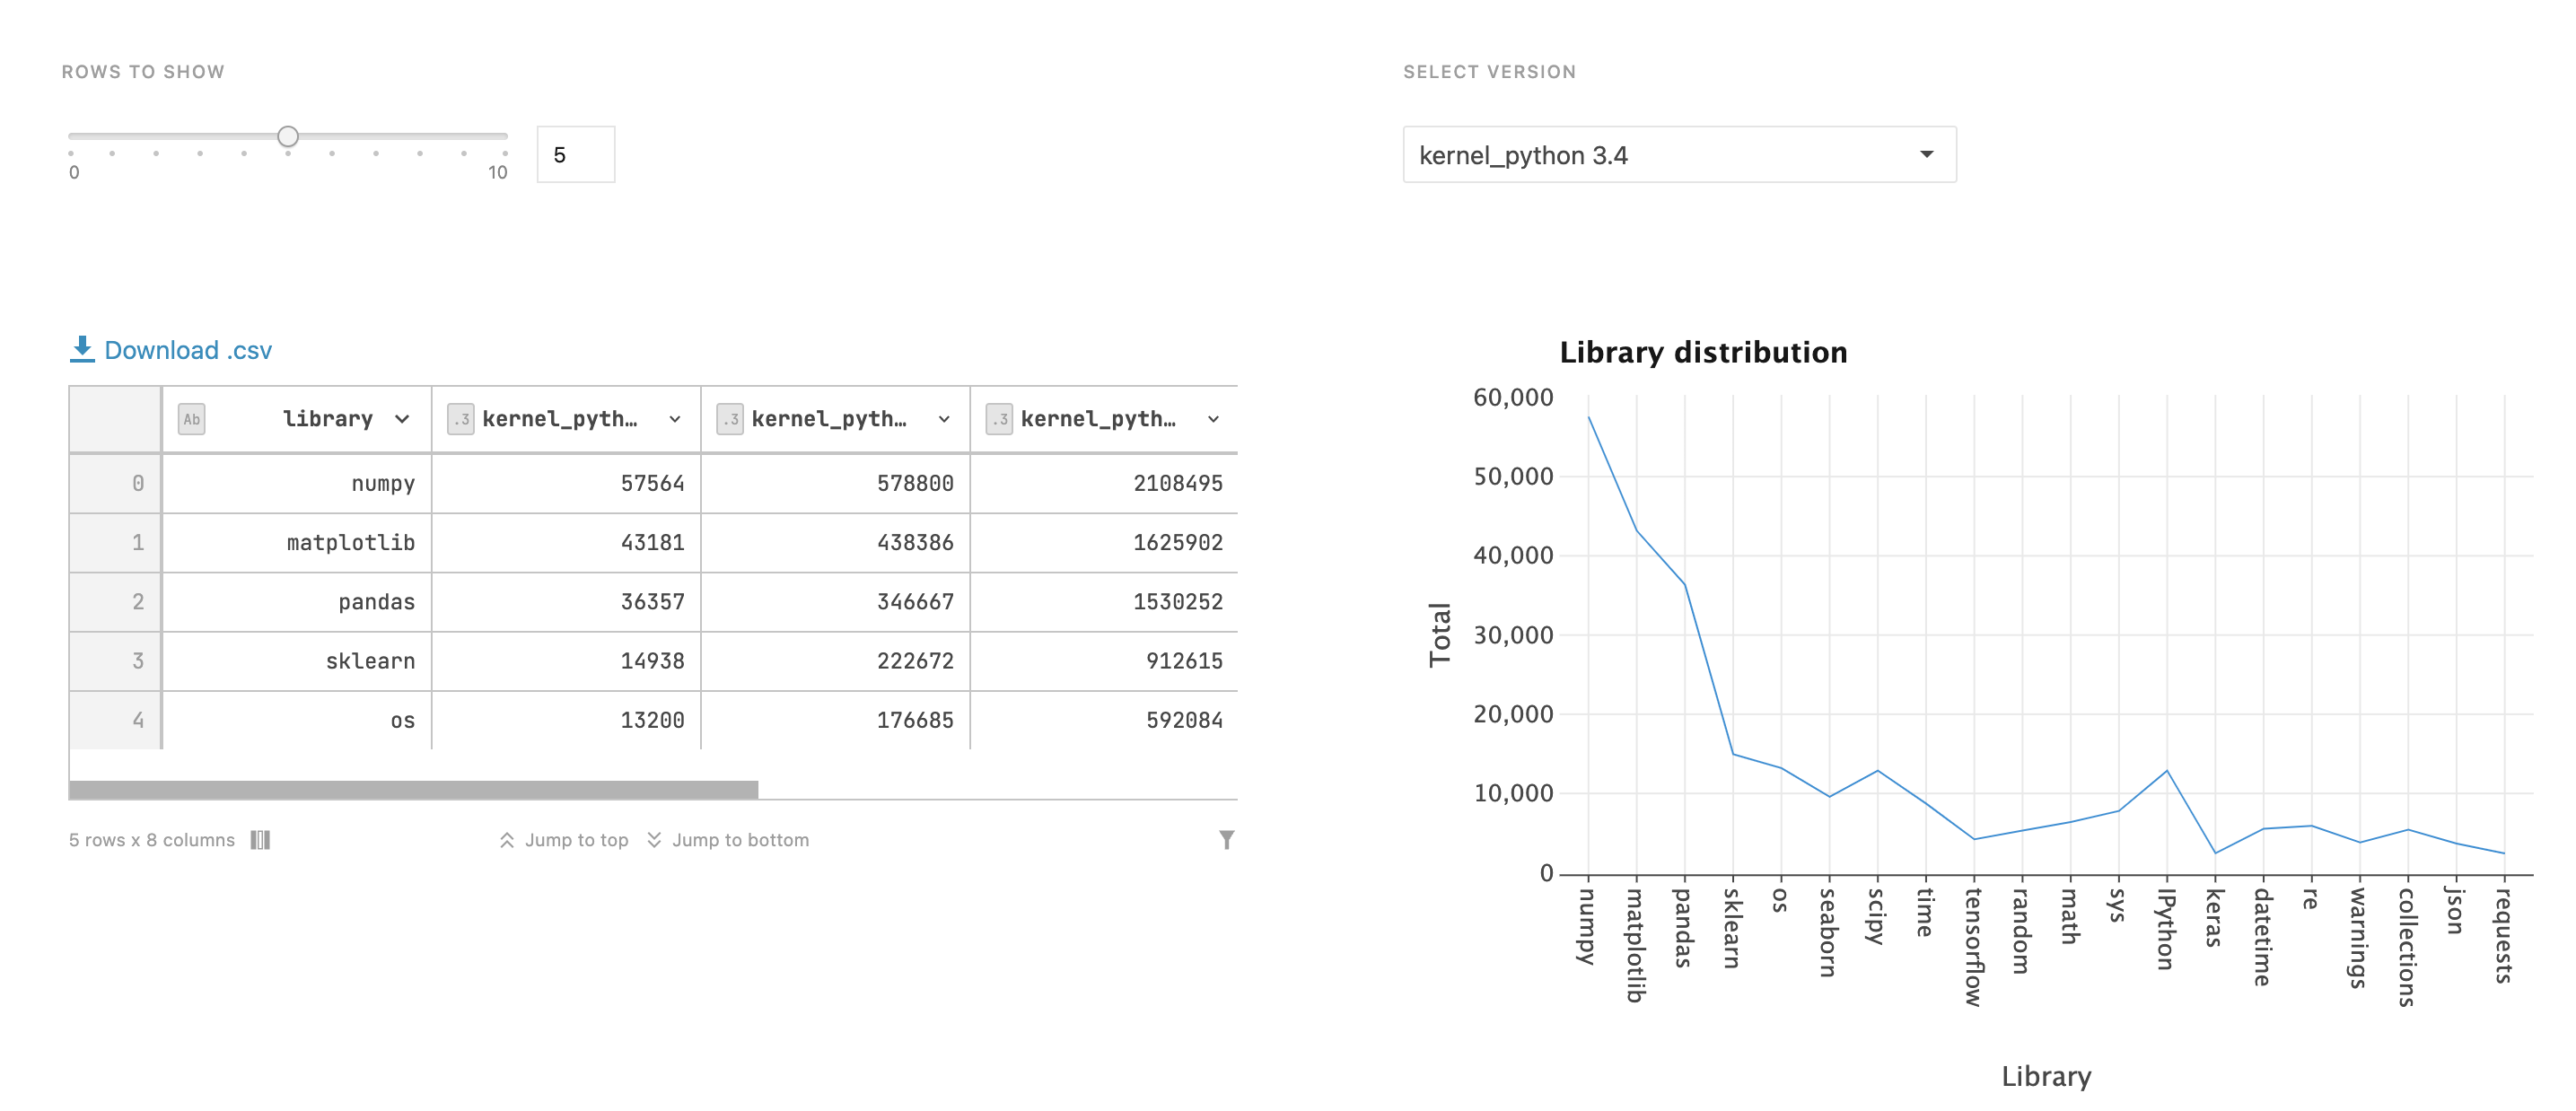
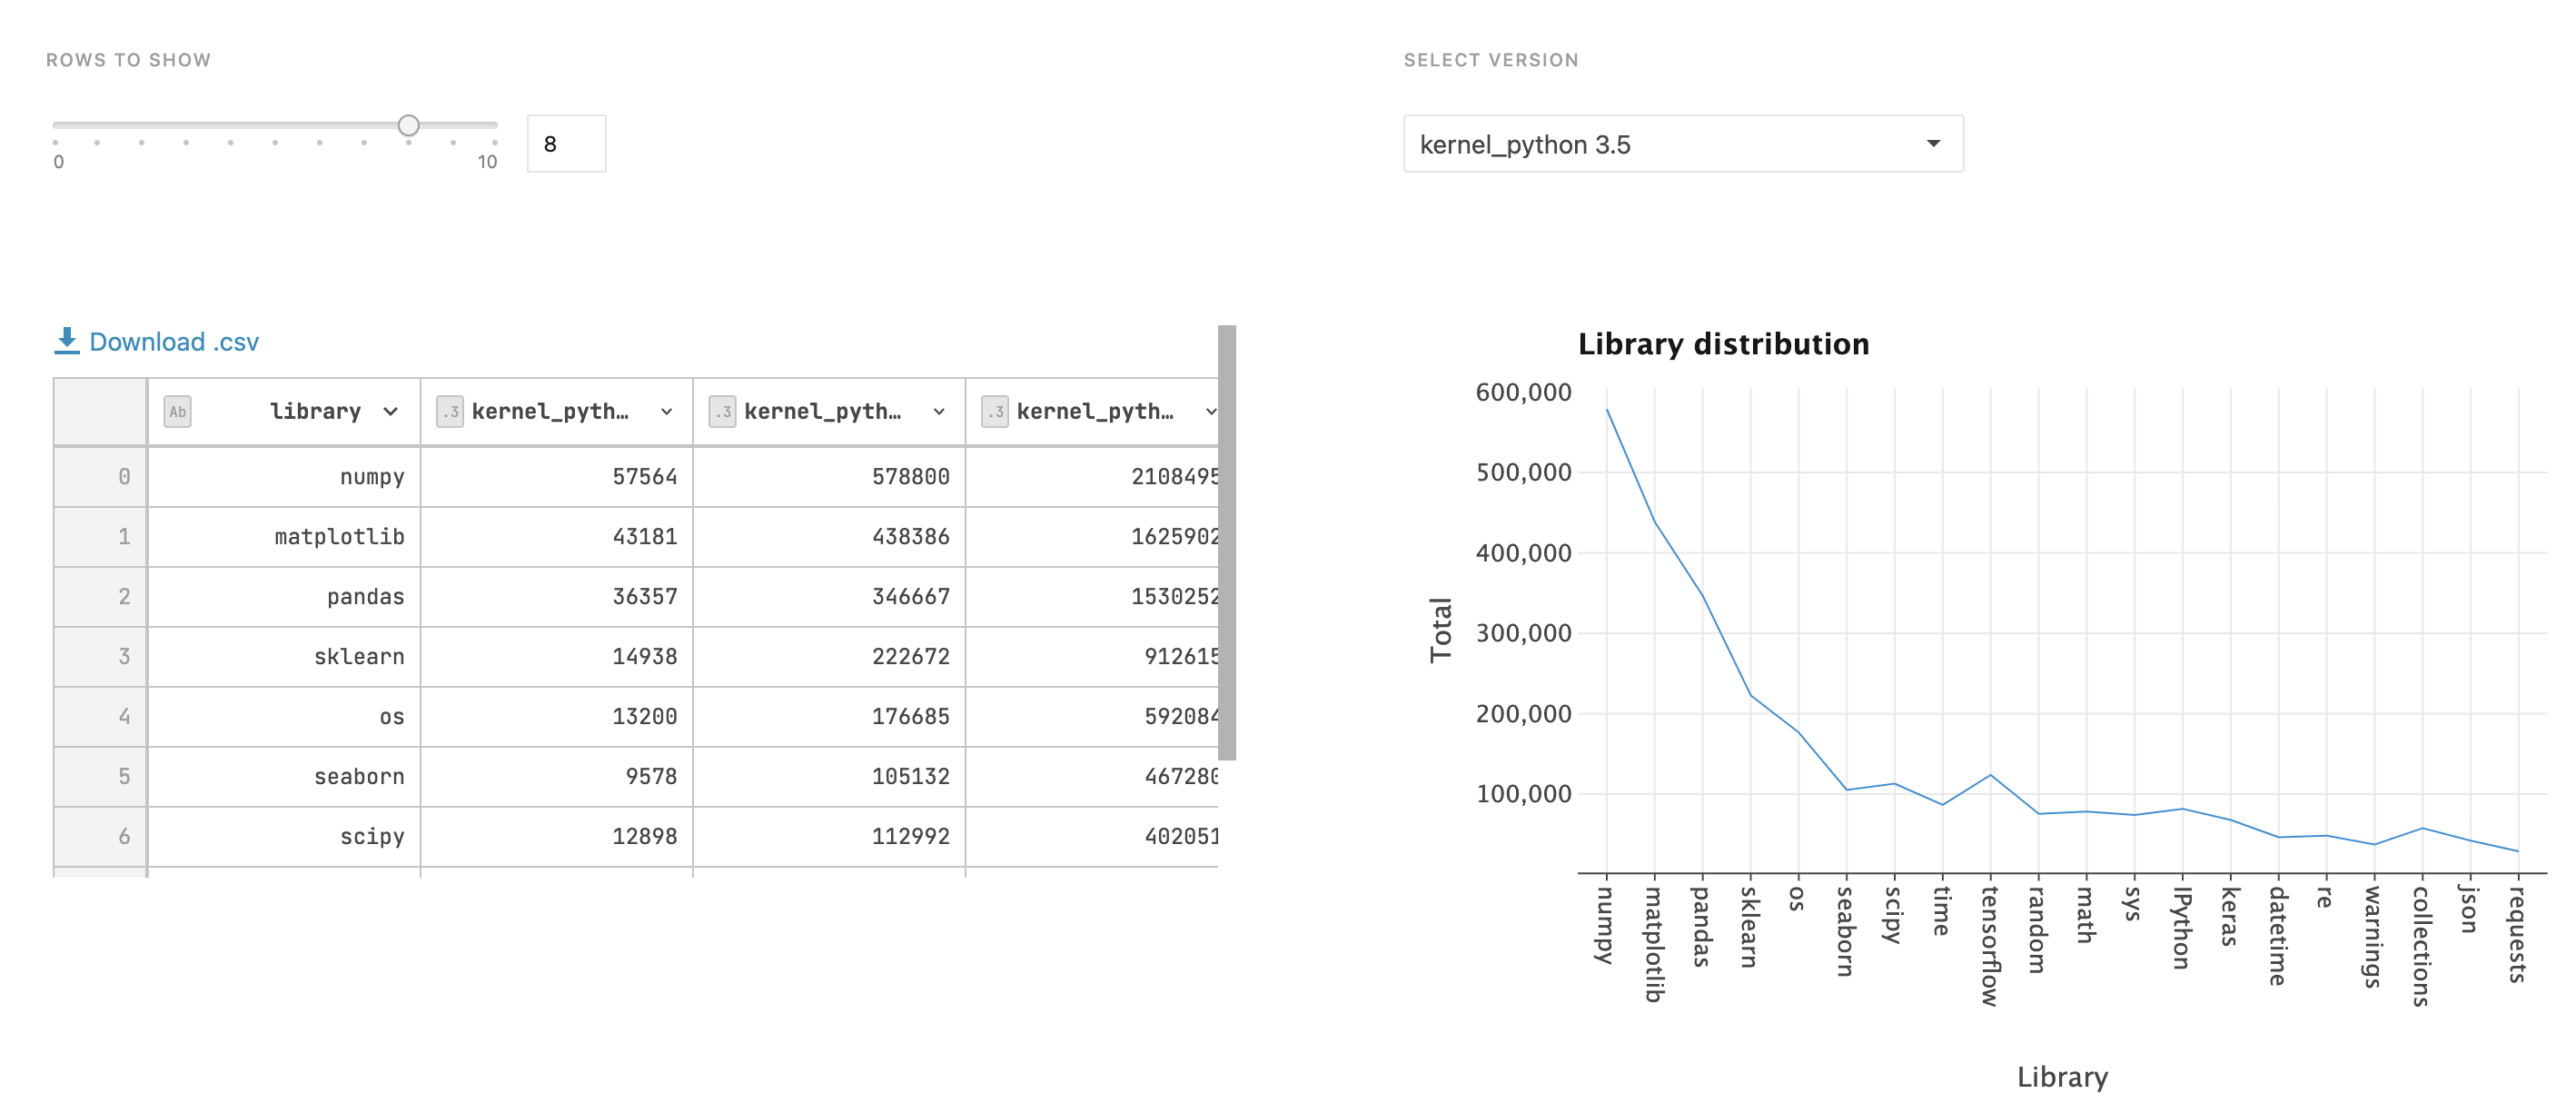
Open an interactive report using the provided link. In the image below, there is an interactive report containing a table and a chart.

Try using the provided controls. In the example below, the controls are:
A slider used to select a number of rows displayed in the table (changed from 5 to 8)
A dropdown used to select a column for the Y axis (changed from kernel_python 3.4 to kernel_python 3.6)

(Optional) If the report owner switched off Reactive mode, to calculate the entire report, click the Recalculate all button in the upper right corner of the report.
To save a table as a .csv file, click the Download .csv icon in the upper left corner of the table.
To add a comment to a report cell:
Hover over the cell that you want to comment.
Click the Add comment icon next to the upper right corner of the cell. If there are no comments left to the cell yet, the icon is grayed out; if there are comments, the icon is green.
In the comment view, click Add comment. A text field will appear in the comment view.
In the text field, type your comment.
After the comment is written, click the Post button.
After the comment is added:
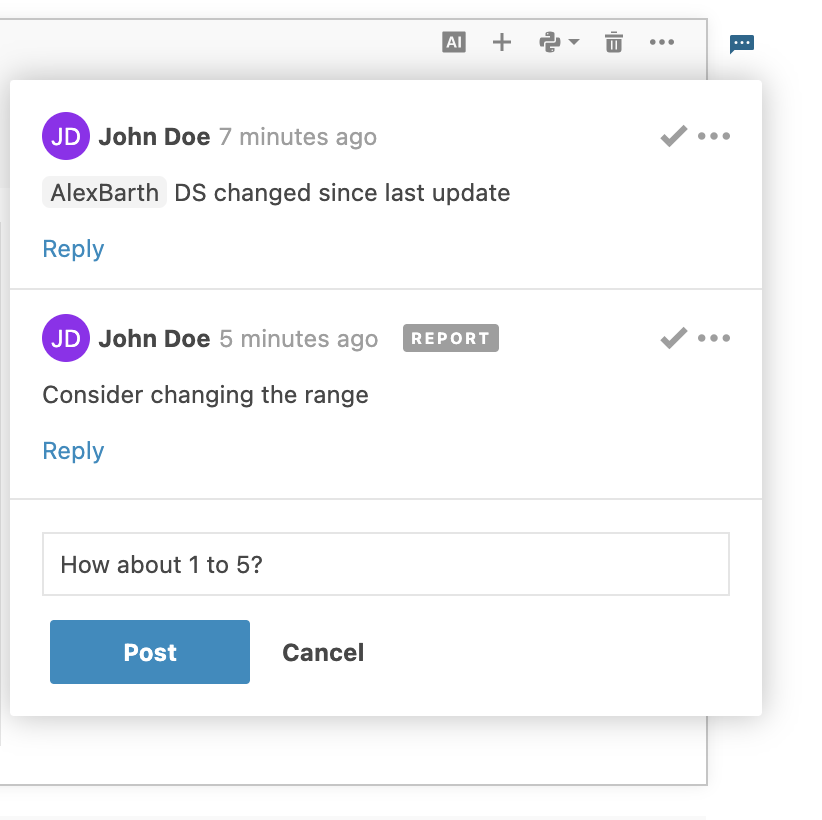
A separate thread is created that will contain the original comment and all replies to it. Multiple comments form a stack of threads, all displayed in the same comment view for the respective cell.
The comment will be marked with a REPORT label when viewed in the notebooke editor.
In the image below, you can see a comment view with two threads. One of the comments was added in the report and marked accordingly.

To edit a code cell in the original notebook, hover over the cell and click the Go to code icon in its upper right corner.

Alternatively, report viewers and report owners can edit a copy of the original notebook. To use the option, clock the Edit copy button in the upper right corner of the report.
Use the report menu
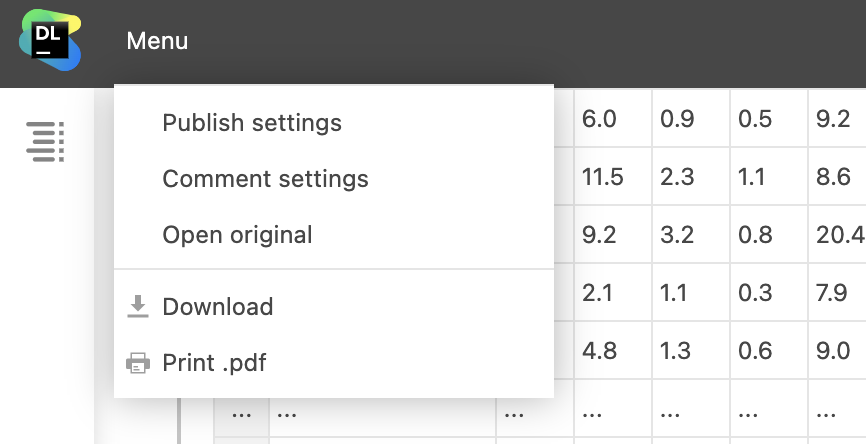
Use the report menu (located in the upper left corner) to use the following options:
Publish settings (for report owner only): select to open the dialog for managing publishing settings and invitations
Comment settings (for report owner only): select to enable or disable comment for this report
Open original (for report owner only): select to open the original notebook used for this report in a new browser tab
Download (for all viewers): select to download the original notebook as an .ipynb file
Print .pdf (for all viewers): select to print or save the report as a .pdf file

View emails of report running users
The REPORT_RUNNER_EMAIL environment variable is populated with the emails of those viewers who run interactive reports (initiators). This information can help you, as a report owner, modify the content of your report based on which user is viewing or running it. For example, you can change the options available in the interactive controls used in the report, or hide certain categories from the tables provided in it.
Cases of when the REPORT_RUNNER_EMAIL environment variable is populated are different in Enterprise and Cloud versions of Datalore.
Enterprise | Cloud Team plan | Other Cloud plans |
|---|---|---|
For all types of authorized users:
| For certain users:
| For one user type only:
|
To access the environment value, you can use the os module: