Statistics tab
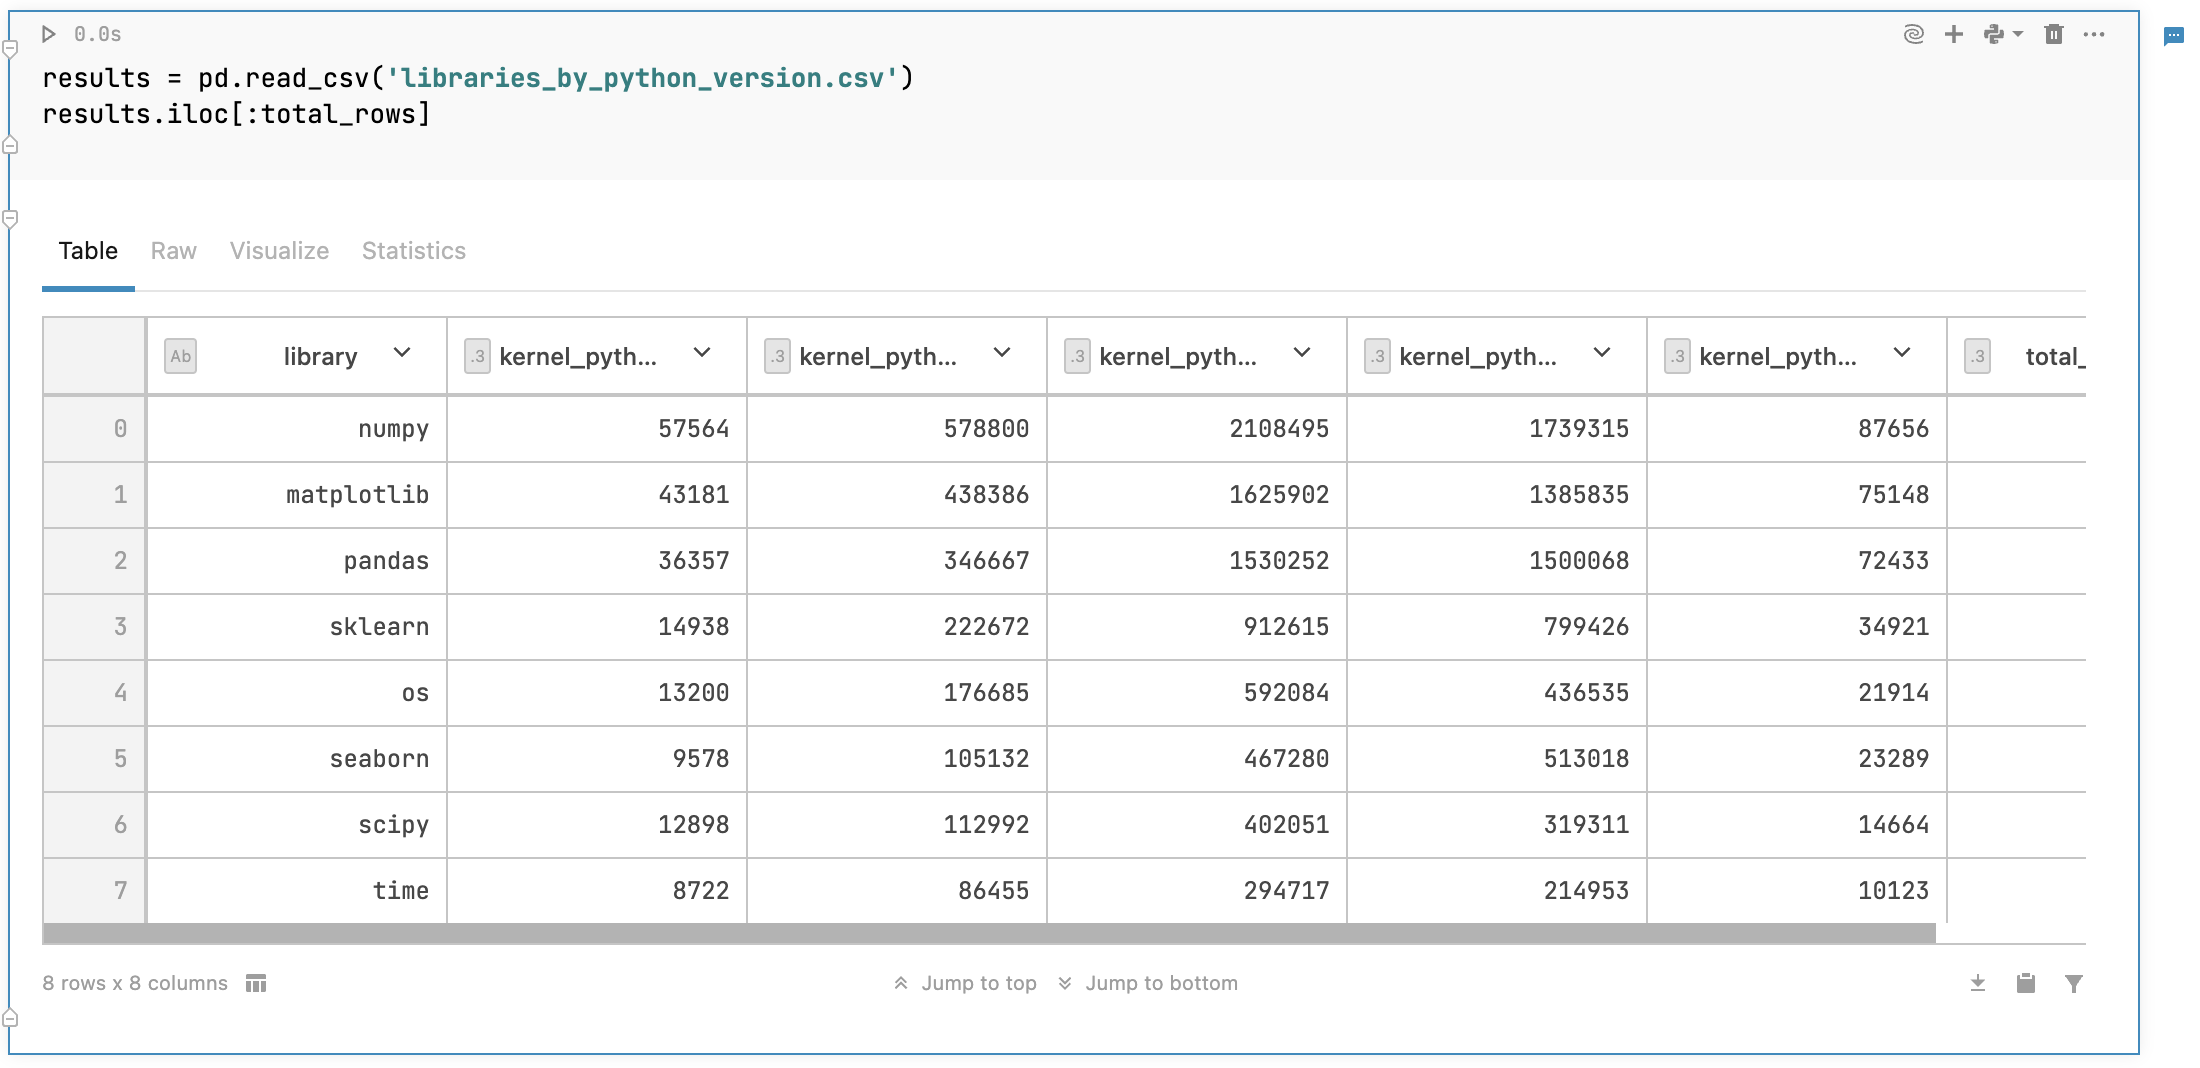
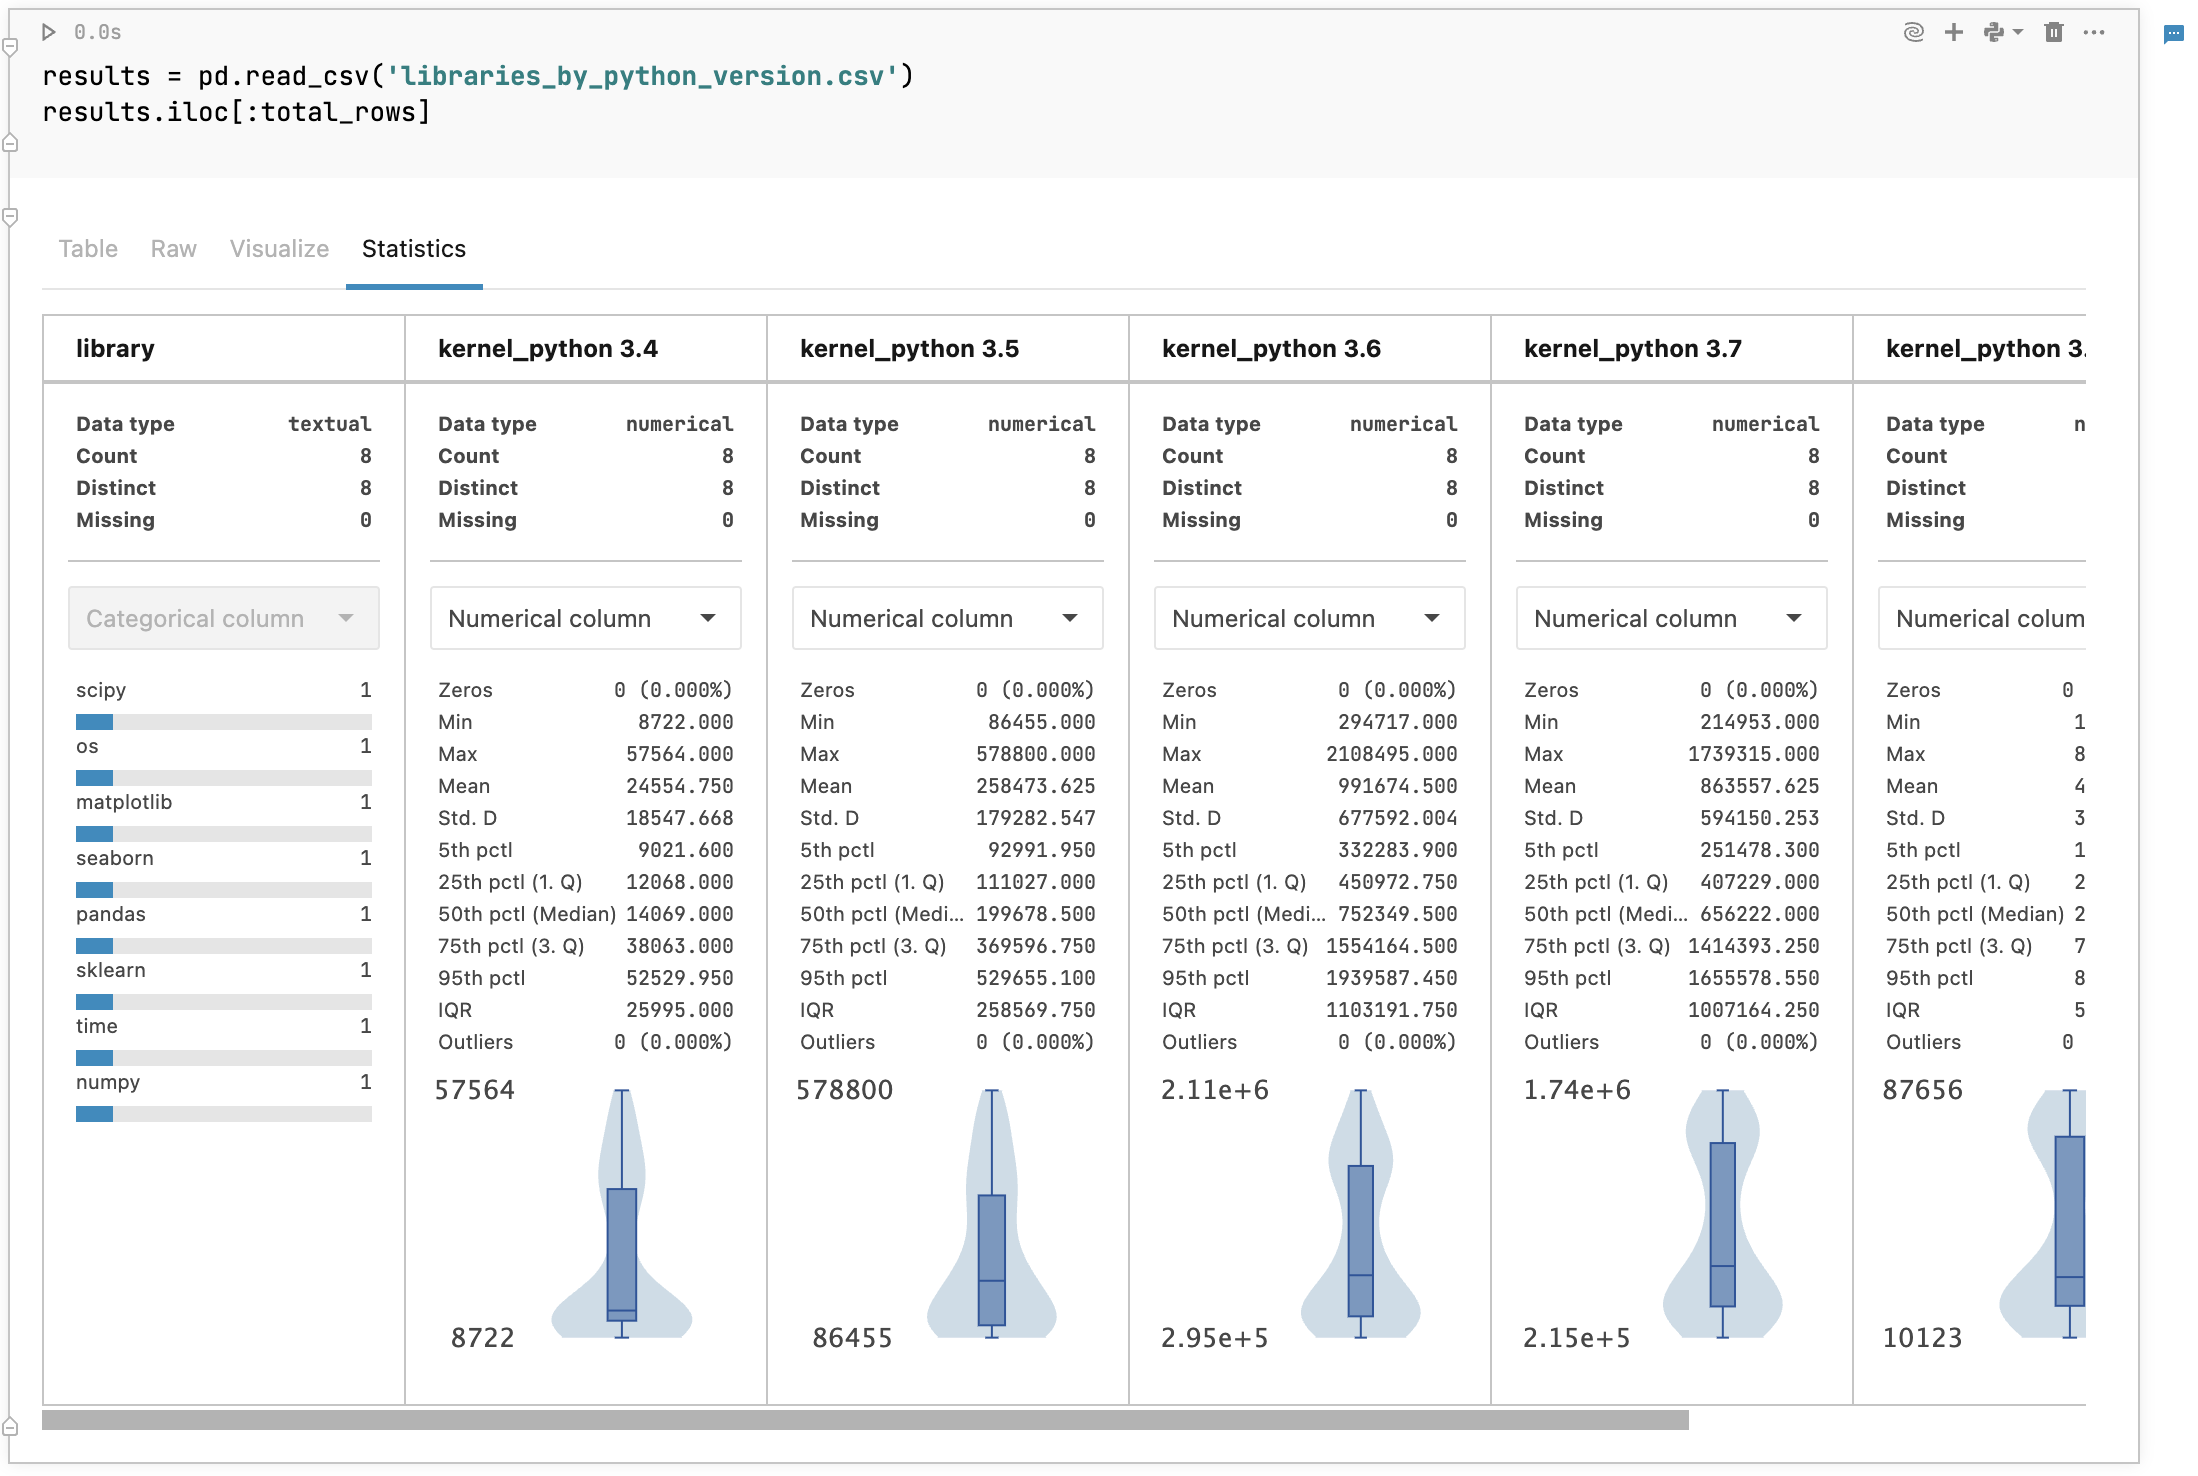
The Statistics tab provides information on the tabular data object of a selected code cell. To get the statistics, run the code cell and switch from the Table tab to the Statistics tab.
Table tab

Statistics tab

How the Statistics tab works
Currently, Datalore distinguishes between two data types: numerical and textual. Each column is presented in the Categorical column view (as containing textual data) or in the Numerical column view (as containing numerical data).
For categorical columns, the Statistics tab shows the distribution of values. For numerical columns, the tab provides the min, max, median, standard deviation, and percentiles, and highlights the percentage of zeros and outliers.
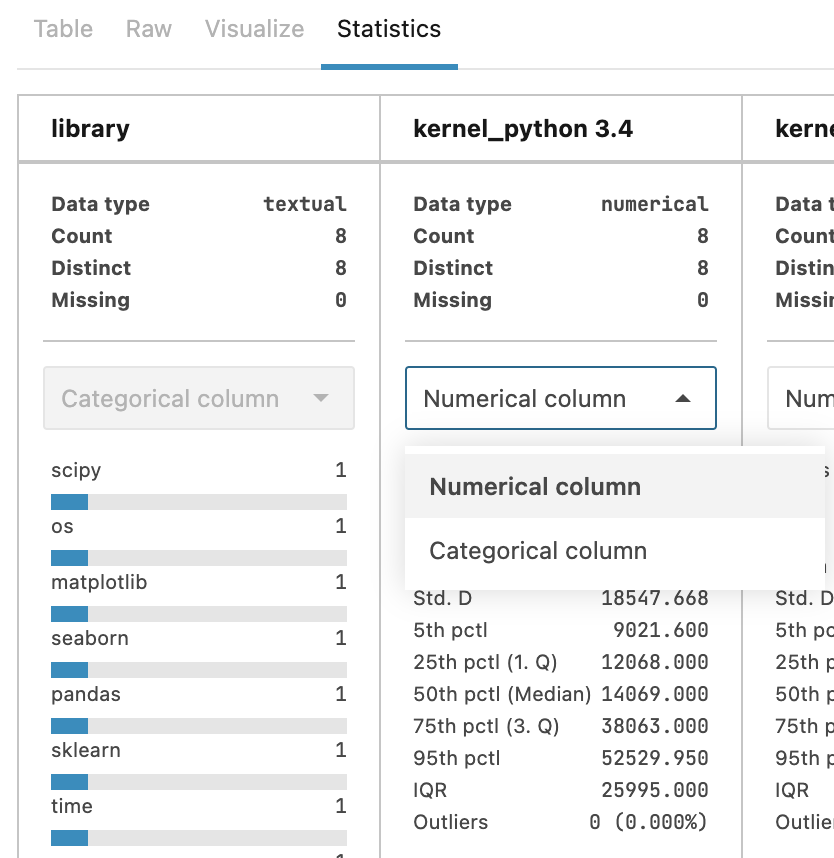
Where applicable, you can change the column view by selecting the other option from the list. In the image below, the column on the left can only be analyzed as containing textual data, and the column on the right can be analyzed as containing either type of data.
