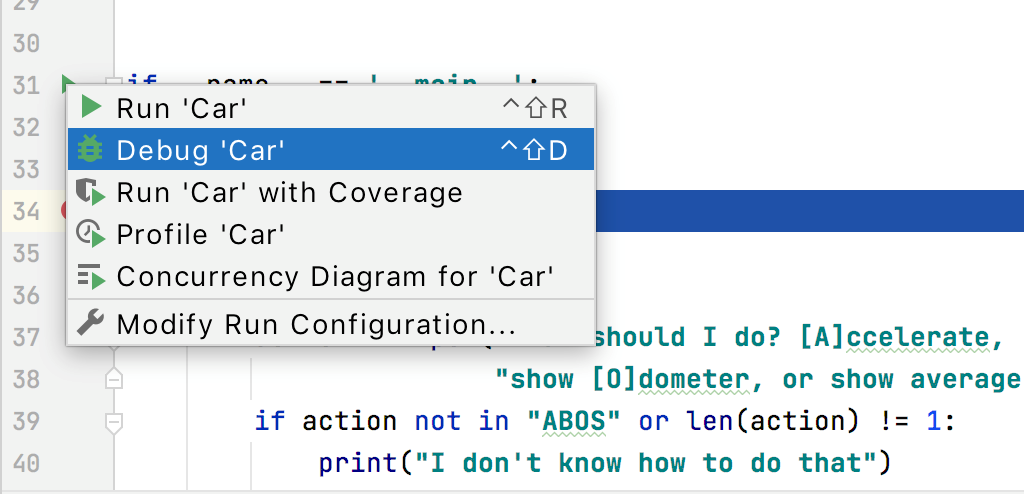
Debug Python code
Starting a debugger session is very similar to running the program in normal mode. The debugger is attached behind the scenes, so you don't have to configure anything specific to start a debugger session. If you are able to run your program from JetBrains DataSpell, you will also be able to debug it using the same configuration.
Click the Run
icon in the gutter near the class with the
main()method and select Debug.
Click the Debug icon (
) on the Python editor toolbar.
Pause/Resume a debugger session
When the debugger session is running, you can pause/resume it as required using the buttons on the toolbar of the Debug tool window:
To pause a debugger session, click
.
To resume a debugger session, click
F9.
Terminate a debugger session
Click the Stop button in the Debug tool window. Alternatively, press Ctrl+F2 and select the process to terminate (if there are two or more of them).
Productivity tips
- Debug non-responding applications
- In case your application hung, pause the session to let the debugger get the information about its current state. You can then examine the program state and locate the cause of the problem.
- Do more with pause
- When you need to evaluate an expression, and JetBrains DataSpell doesn't let you do that because you didn't stop at a breakpoint, you can advance your program a line further by stepping. After this, you will be able to use the debugger as if you had stopped at a breakpoint. While in some cases this may not be a valid solution, it may sometimes help you out.