Jupyter notebooks
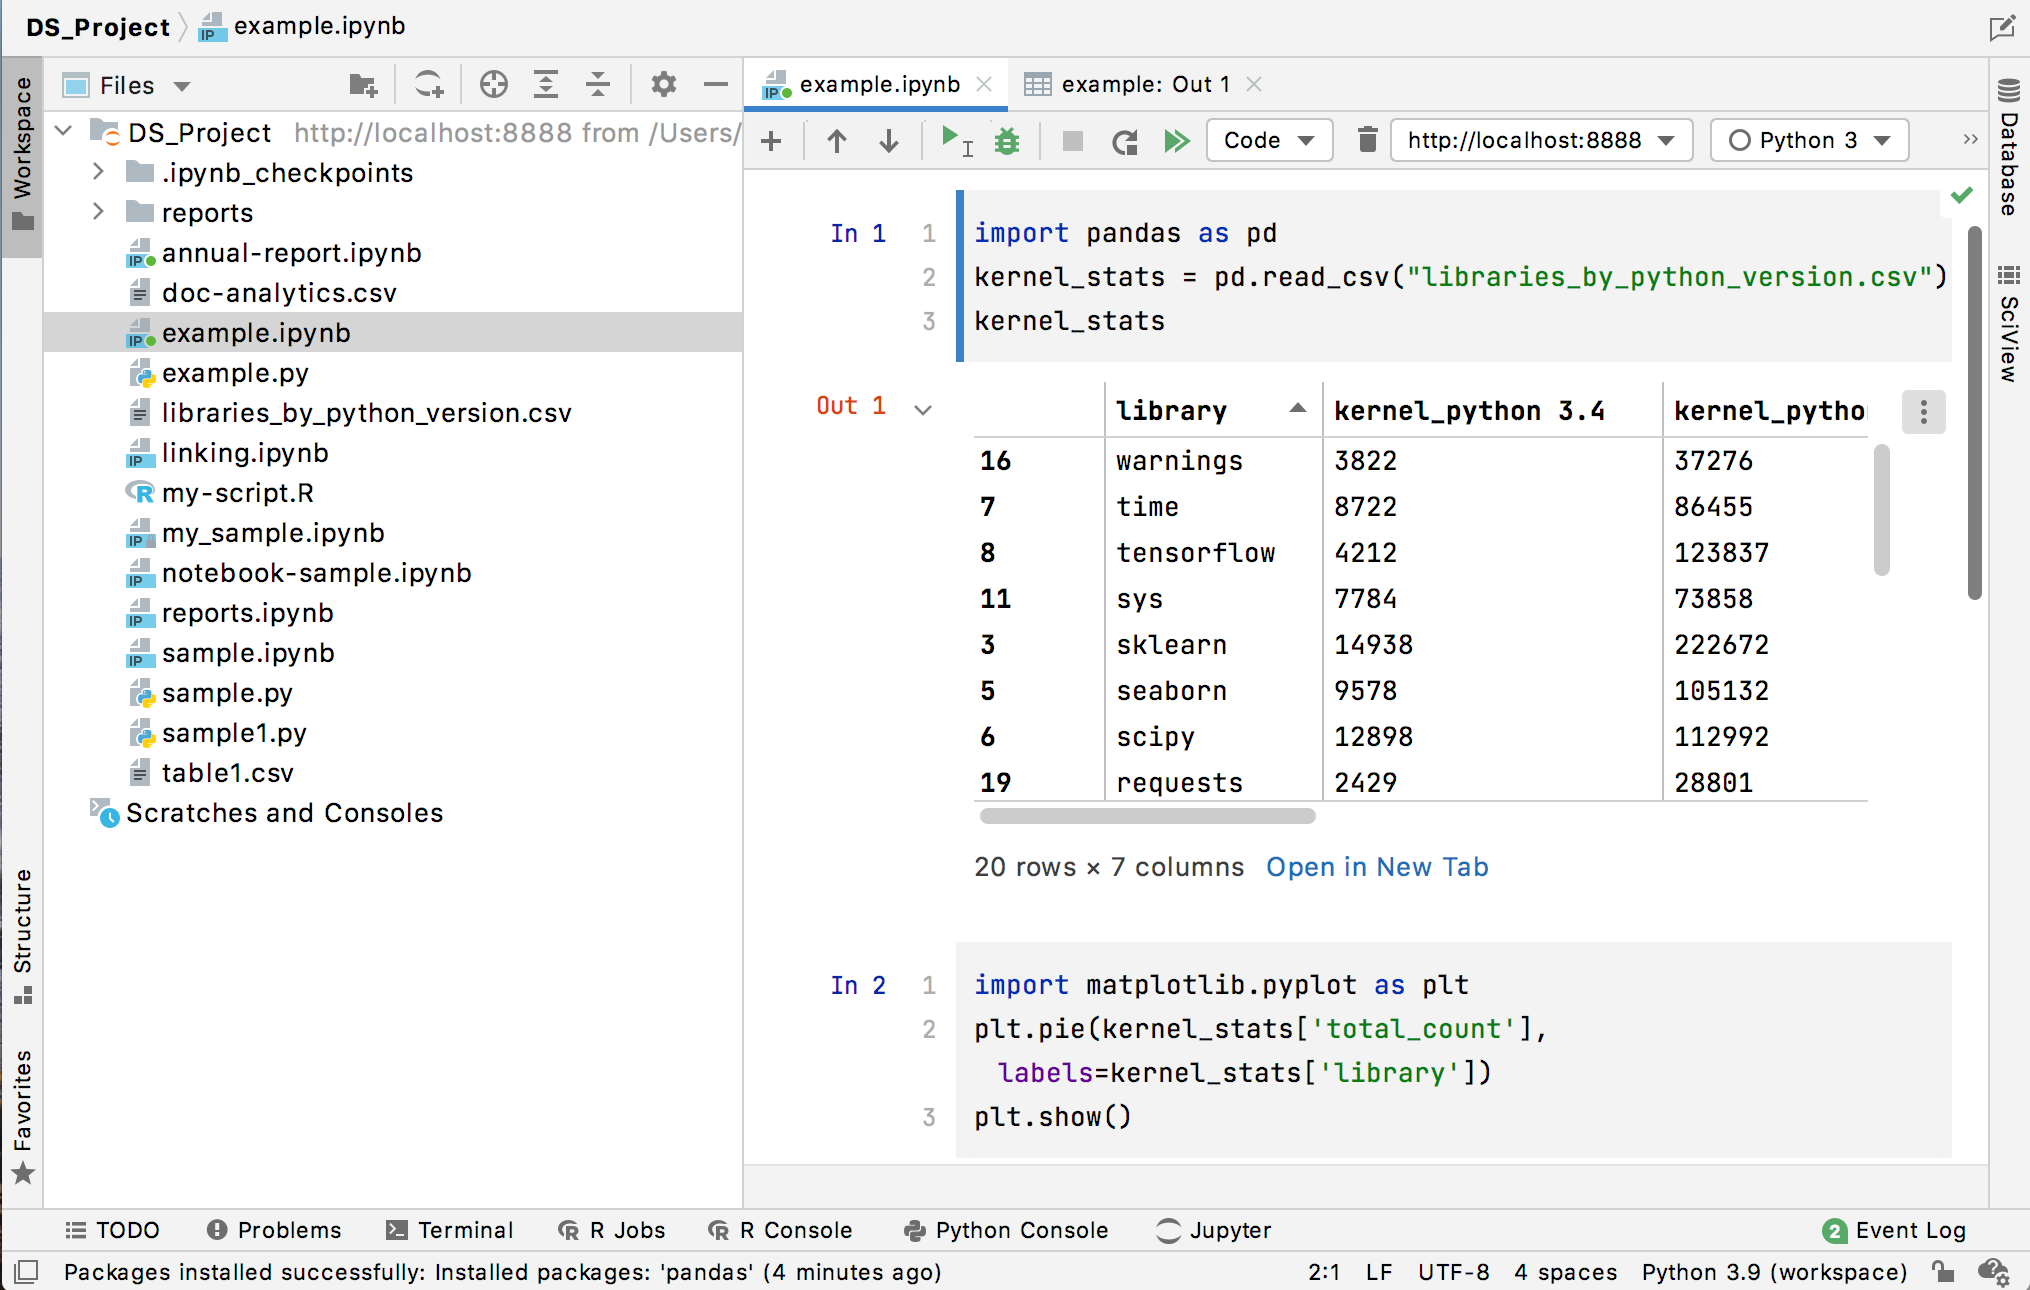
With Jupyter Notebook integration available in DataSpell , you can easily edit, execute, and debug notebook source code and examine execution outputs including stream data, images, and other media. 
Notebook support in DataSpell includes:
Editing and preview:
Ability to present a notebook as source code with textual cell definitions and manipulate cells as regular code.
Live preview of the cell execution output and Markdown content.
Auto-saving changes that you make in your files. Saving is triggered by various events, for example, closing a file or a project, or quitting the IDE.
Coding assistance:
Error and syntax highlighting.
Code completion.
Ability to create line comments Ctrl+/.
Ability to run cells and preview execution results.
Dedicated Jupyter Notebook Debugger.
Shortcuts for basic operations with Jupyter notebooks.
Ability to recognize .ipynb files and mark them with the
icon.
Quick start with the Jupyter notebook in DataSpell
To start working with Jupyter notebooks in DataSpell:
Open files in your working space.
If needed, configure or create a new virtual environment.
Add and edit source cells.
Execute any of the code cells to launch the Jupyter server.
Get familiar with the user interface
Mind the following user interface features when working with Jupyter notebooks in DataSpell.
Notebook editor

A Jupyter notebook opened in the editor has its specific UI elements:
Jupyter notebook toolbar: provides quick access to the most popular actions. The rest of the notebook specific actions are available in the menu.
Code cell: a notebook cell that contains an executable code
Cell output: results of the code cell execution; can be presented by a text output, table, or plot.
Cell toolbar: a toolbar of the code cell with the most popular commands. By default, cell toolbars are disabled. To enable them, open project settings/preferences (Ctrl+Alt+S), go to , and select the Show cell toolbar checkbox.
Cell toolbar
Each code cell has its configurable toolbar so that you can easily access the most popular commands and actions. By default, cell toolbars are disabled. To enable them, open project settings/preferences (Ctrl+Alt+S), go to , and select the Show cell toolbar checkbox.
Toolbar element | Description |
|---|---|
| Executes the code cell. You can also press Ctrl+Enter to run the code cell. |
Executes this cell and select the cell below. Press Shift+Enter to call the same action. | |
| Moves the current cell up |
Moves the current cell down | |
Deletes the current cell | |
Open the list of additional call actions:
|
Notebook toolbar
The Jupyter notebook toolbar provides quick access to all basic operations with notebooks:

Toolbar element | Description |
|---|---|
| Add a code cell below the selected cell. |
| Moves the current cell up |
Moves the current cell down | |
Executes this cell and selects a cell below. If there is no a cell below, DataSpell will create it. | |
| Starts debugging for this cell. |
Click this icon if you want to interrupt any cell execution. | |
Click this icon to restart the currently running kernel | |
Executes all cells in the notebook. | |
| You can select a cell type from this list and change the type for the selected cell. |
| Deletes the current cell. |
| The Jupyter Server widget that shows the currently used Jupyter server. Click the widget and select to setup another local or remote Jupyter server. |
| List of the available Jupyter kernels. |
| Select this checkbox to allow executing JavaScript in your Jupyter notebook. |
This actions selects the cell above. | |
This actions selects the cell blow. | |
You can preview the notebook in a browser. |
Tool windows
The Server Log tab of the Jupyter tool window appears when you have any of the Jupyter server launched. The Server log tab of this window shows the current state of the Jupyter server and the link to the notebook in a browser.

It also provides controls to stop the running server (![]() ) and launch the stopped server (
) and launch the stopped server ().
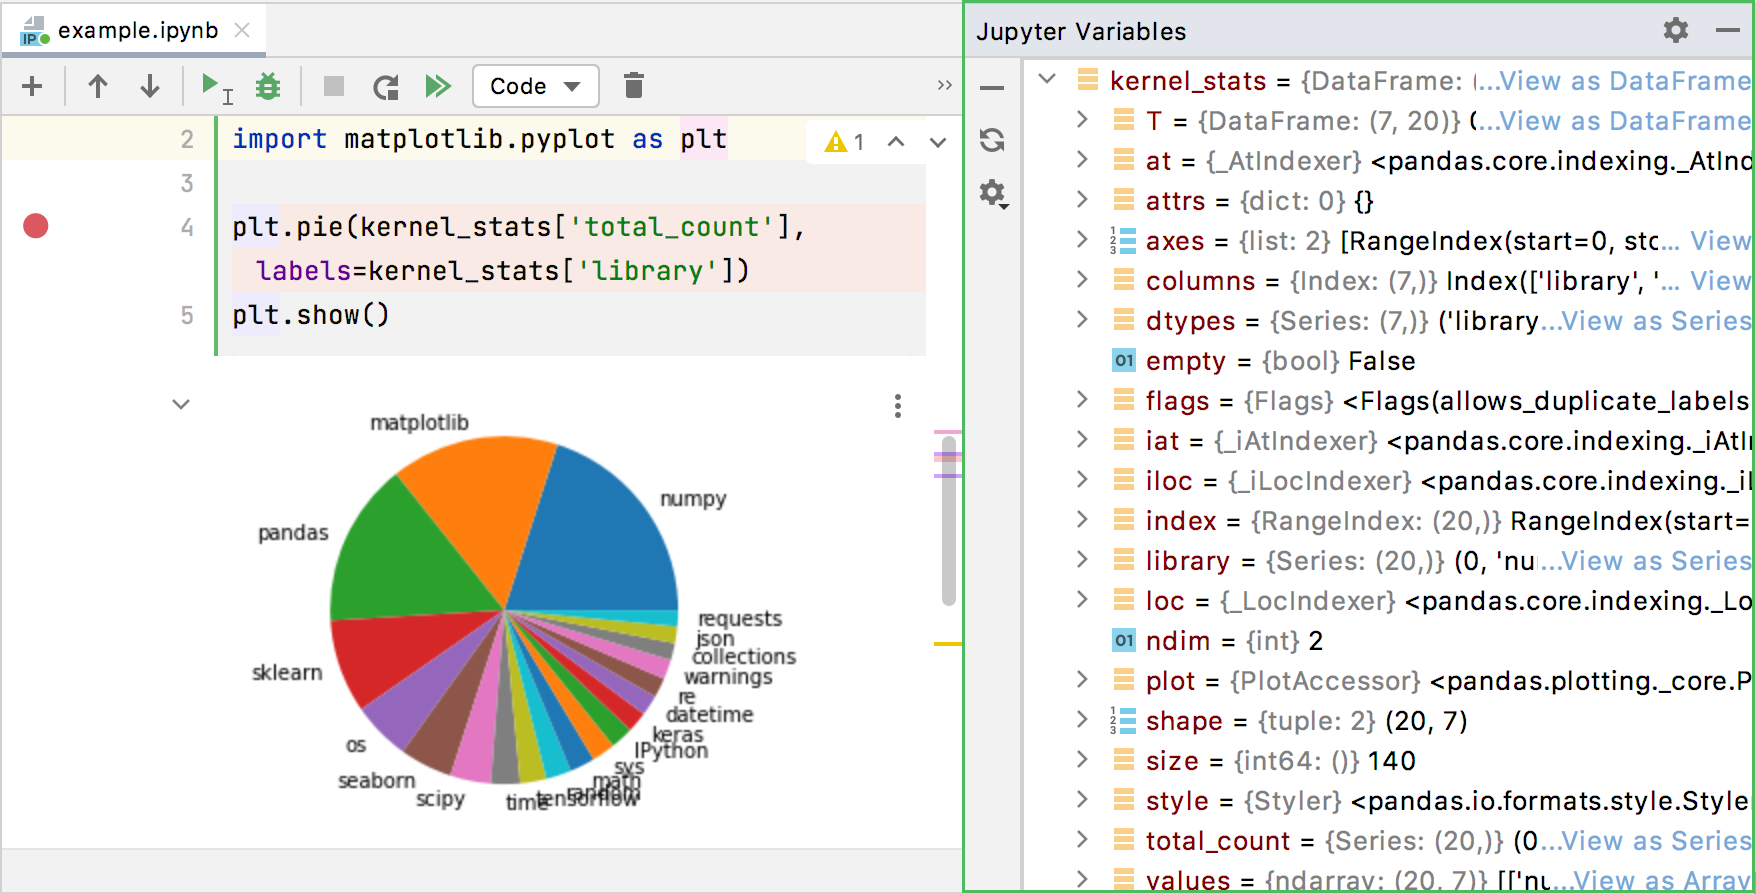
The Jupyter Variables tool window the detailed report about variable values of the executed cell.
