Run Python code
Once you have created a Python file and configured a virtual environment, you can execute your code.
The Python editor toolbar provides quick access to the most popular actions:
Icon | Action |
|---|---|
| Adds a code cell below the selected cell. |
Moves the selected code cell the current location to the clipboard. | |
Copies the selected code cell to the clipboard. | |
Inserts the contents of the clipboard into a new code cell below the selected one. | |
| Moves the current cell up. |
Moves the current cell down. | |
Executes this cell and selects a cell below. If there is no a cell below, DataSpell will create it. | |
Runs code of the Python file in the Python Console. | |
Starts debugging Python code. | |
| Deletes the current cell. |
You can execute your script in the interactive read-evaluate-print loop (REPL) Python Console. You can even execute a selected fragment of your code, or a Python code cell.
Python console
Python console enables executing Python commands and scripts line by line, similar to your experience with Python Shell. The console is located in the lower group of the DataSpell tool windows and it opens each time you initiate code execution in it. You can also open it by selecting from the main menu.
Run a file in the Python Console
To run a Python script in the console, click
on the Python editor toolbar.
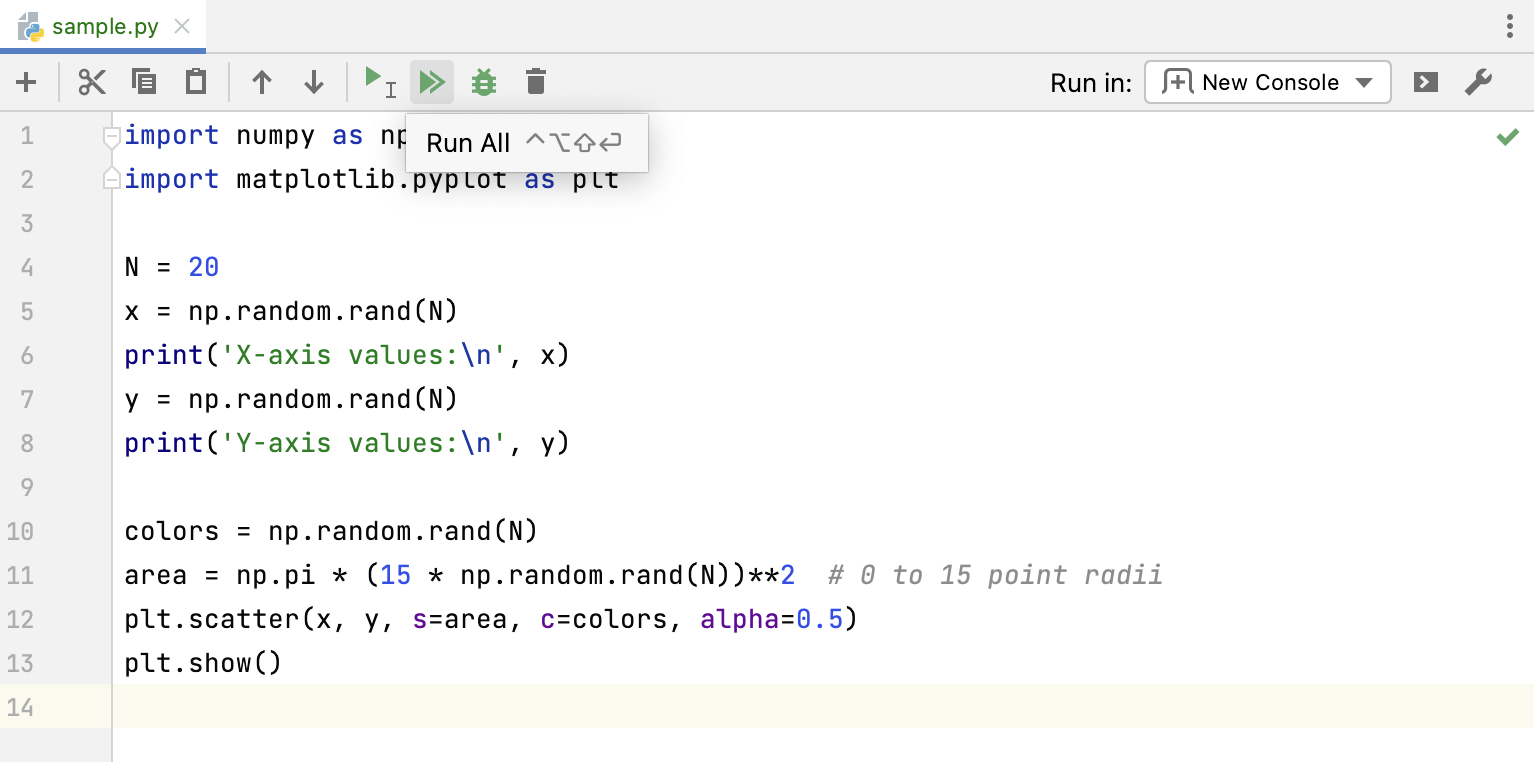
Once you initiate running, the Python Console opens and you should see the code execution.
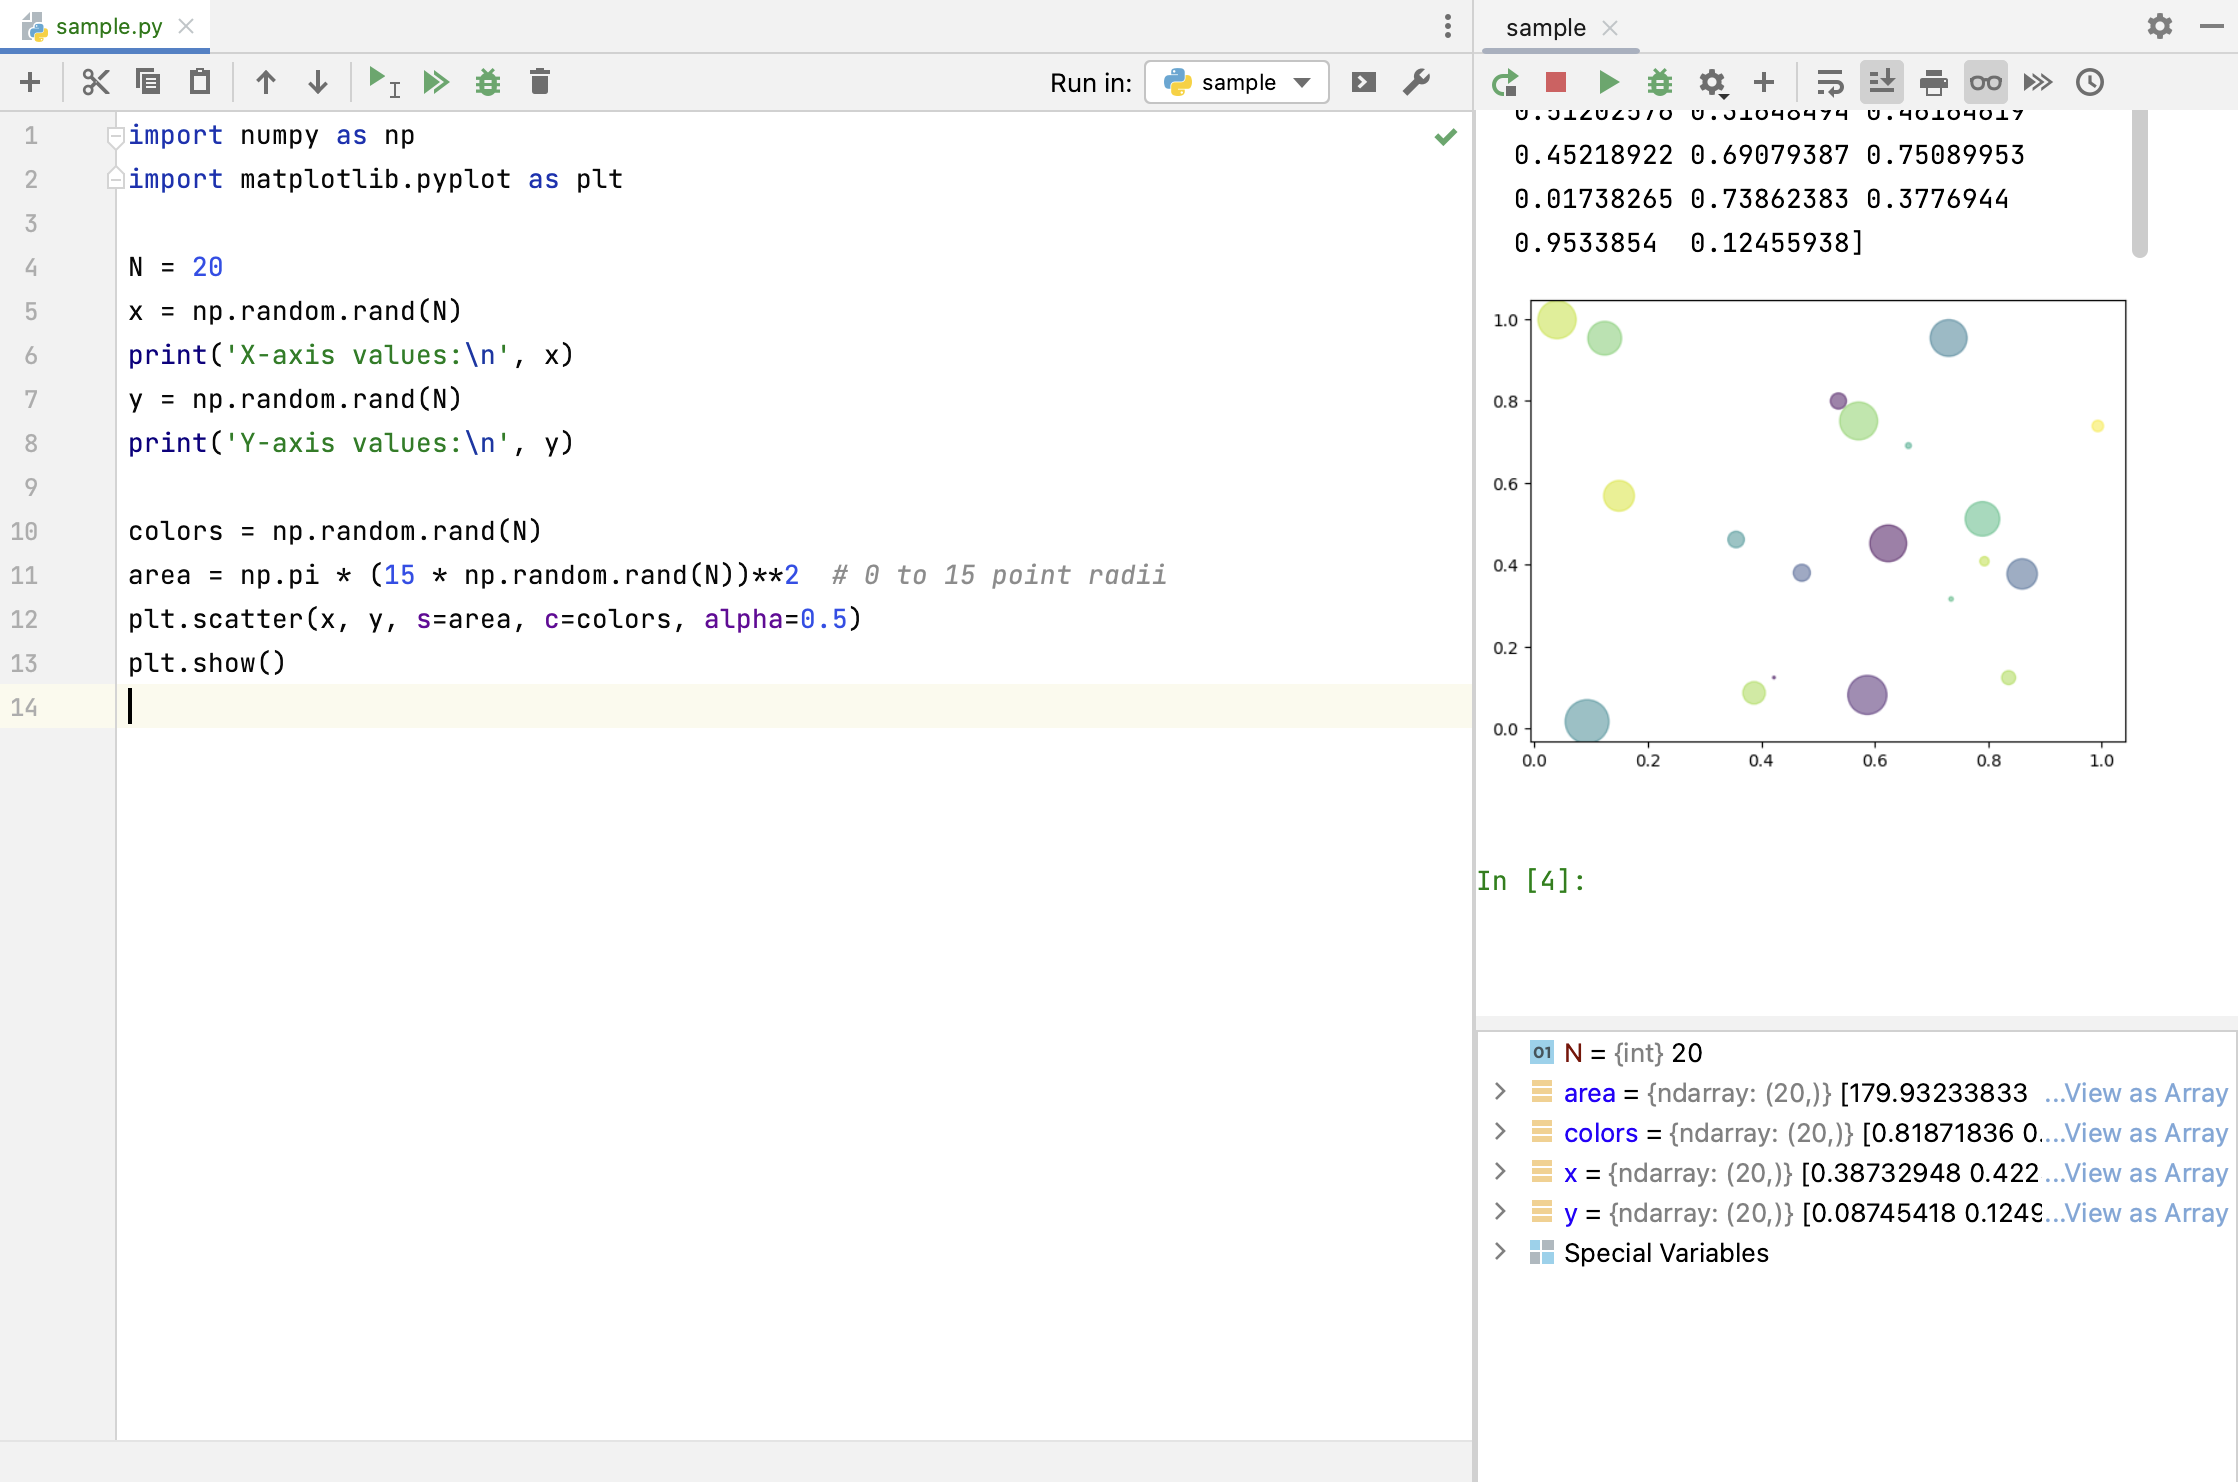
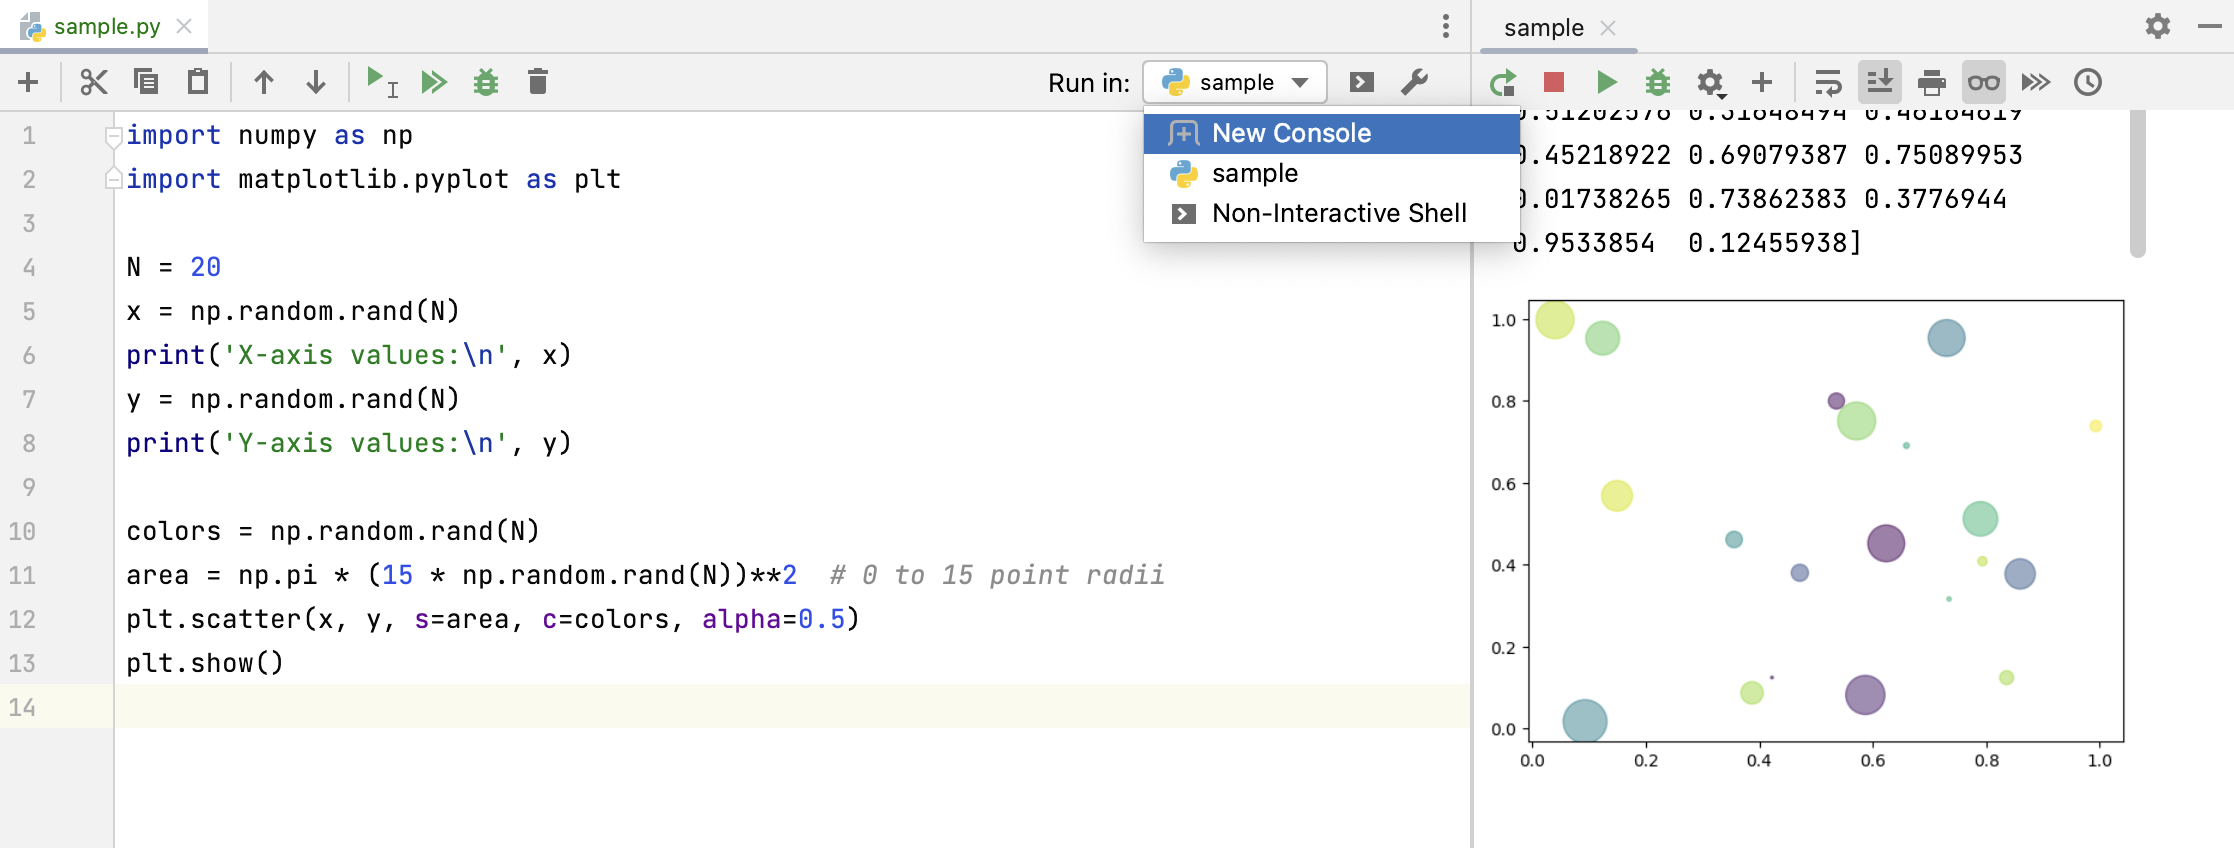
By default, each console has a name that corresponds to the filename of the executed file with the index. So, if you want to execute sample.py in a new console, it will be run in the tab with the name sample (1). Use the list in the upper-right corner of the Python editor to select a particular console you need.
To rename a console tab, right-click it, select Rename Console, and enter any meaningful name.
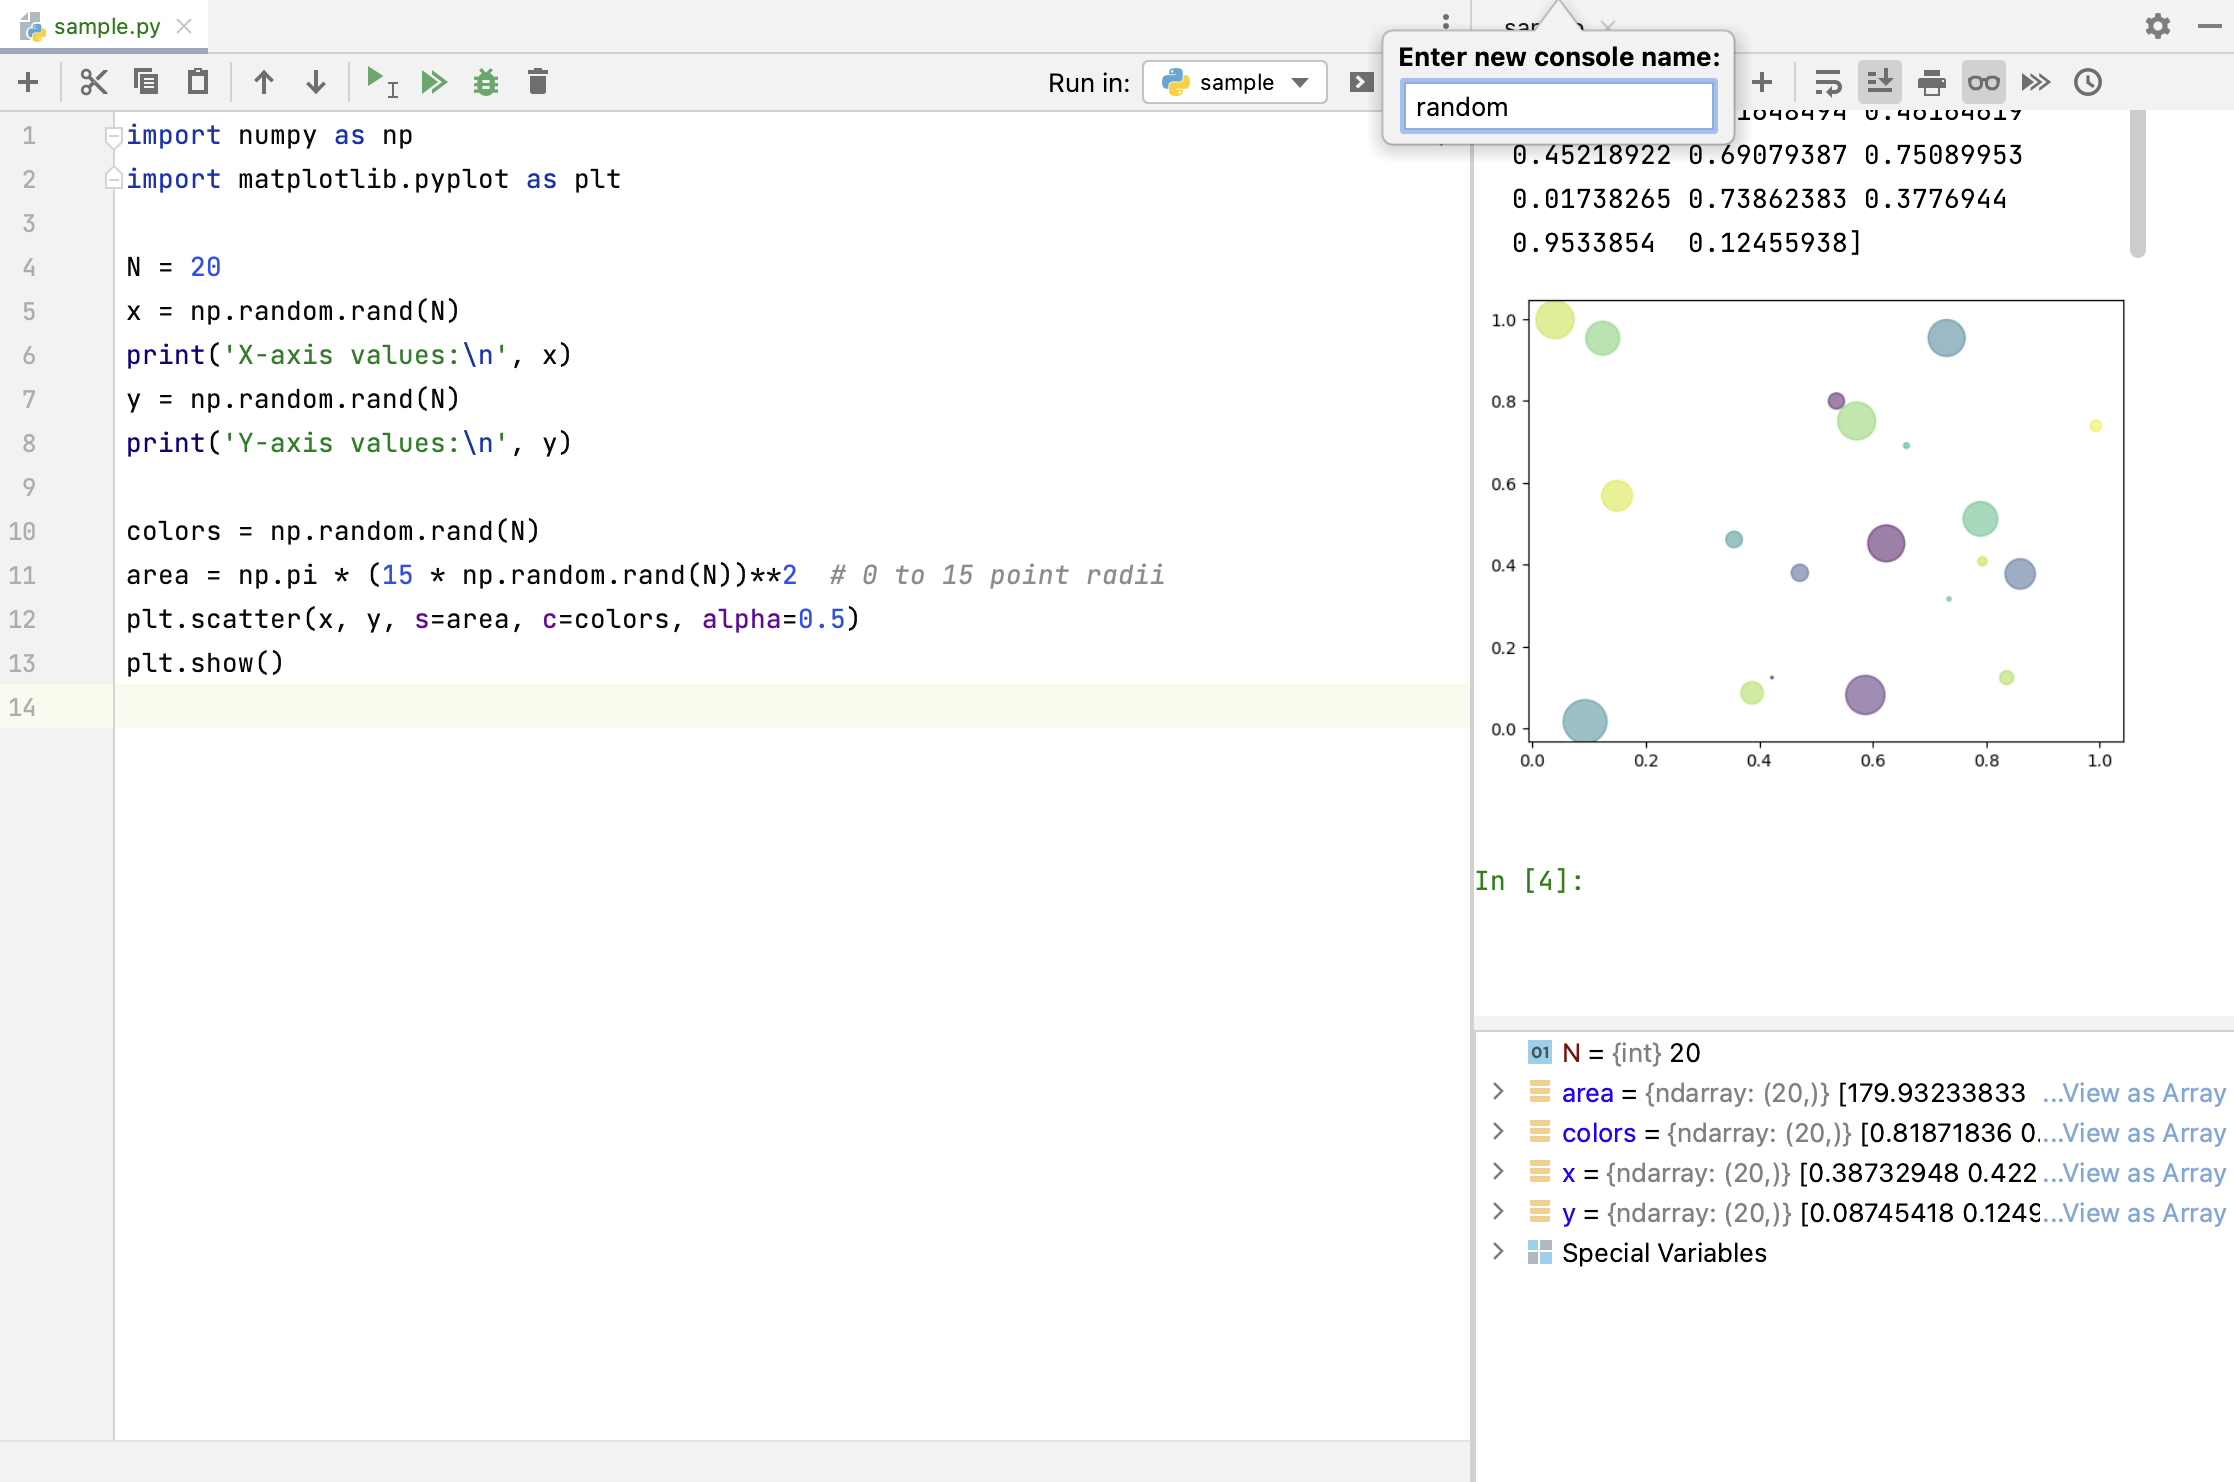
The renamed console is shown in the list of the consoles:
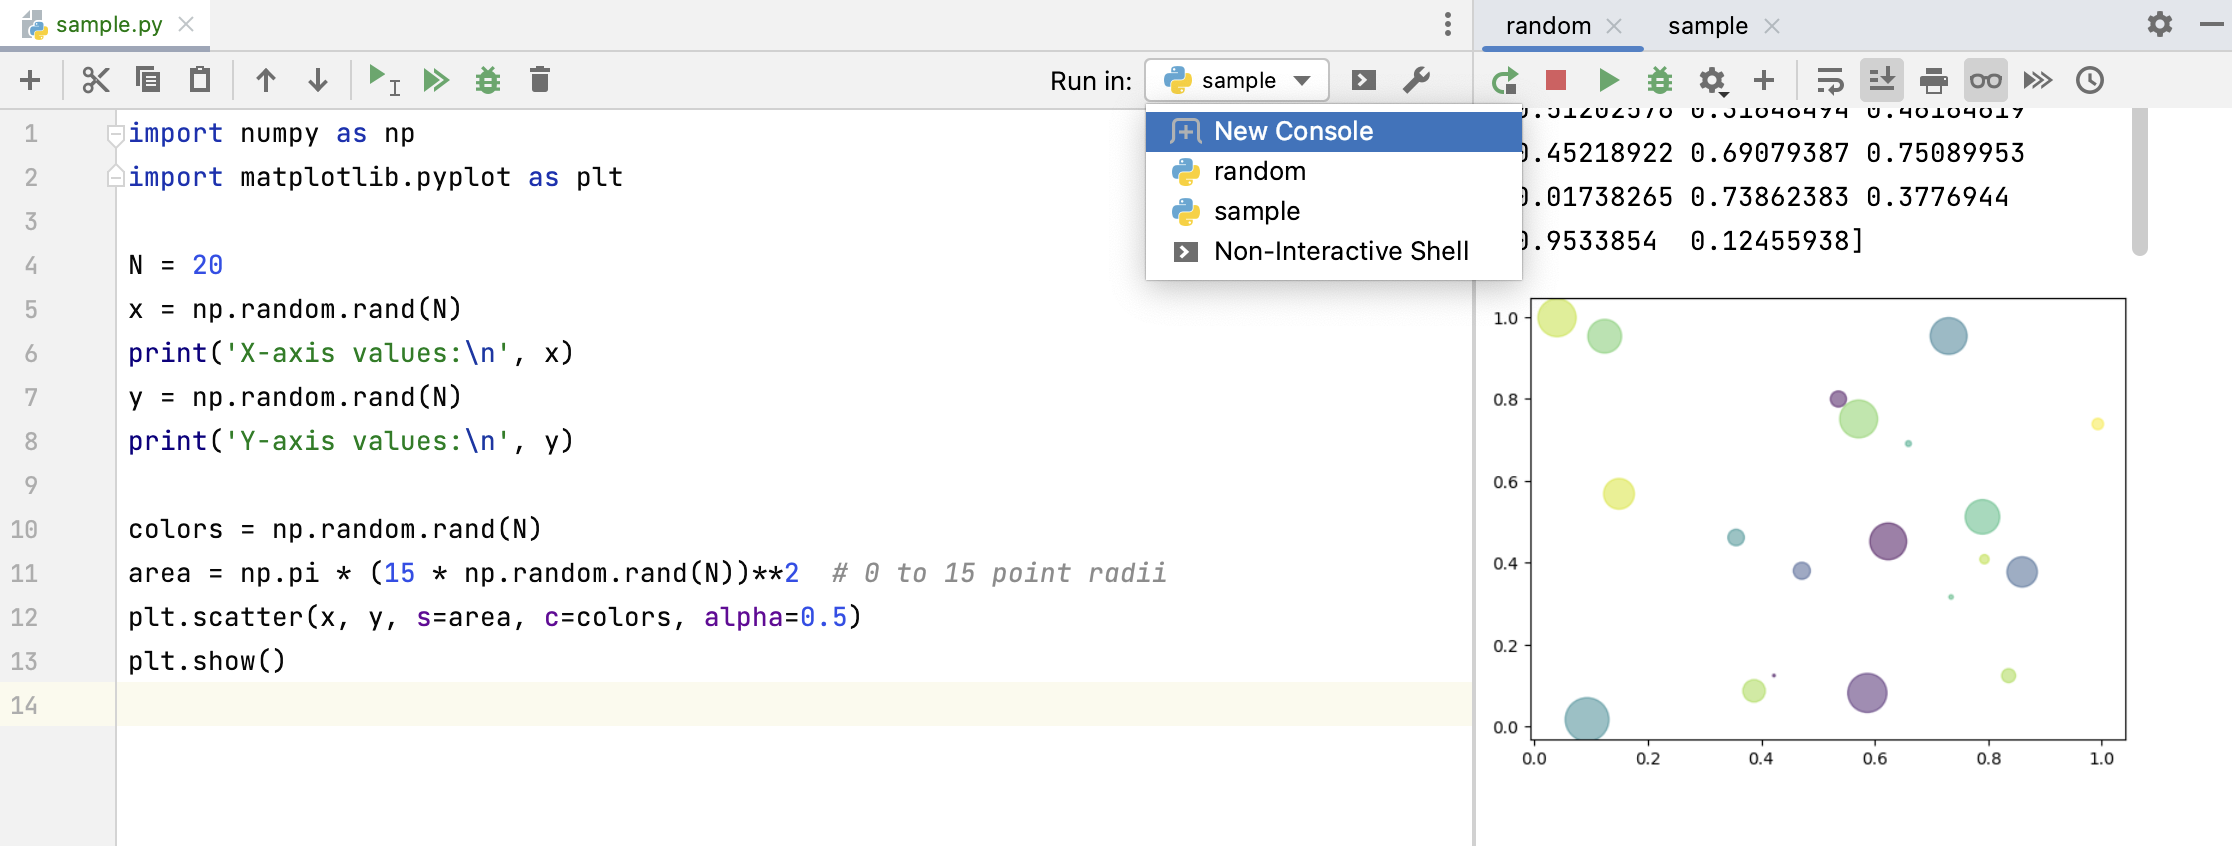
Run code in a non-interactive console
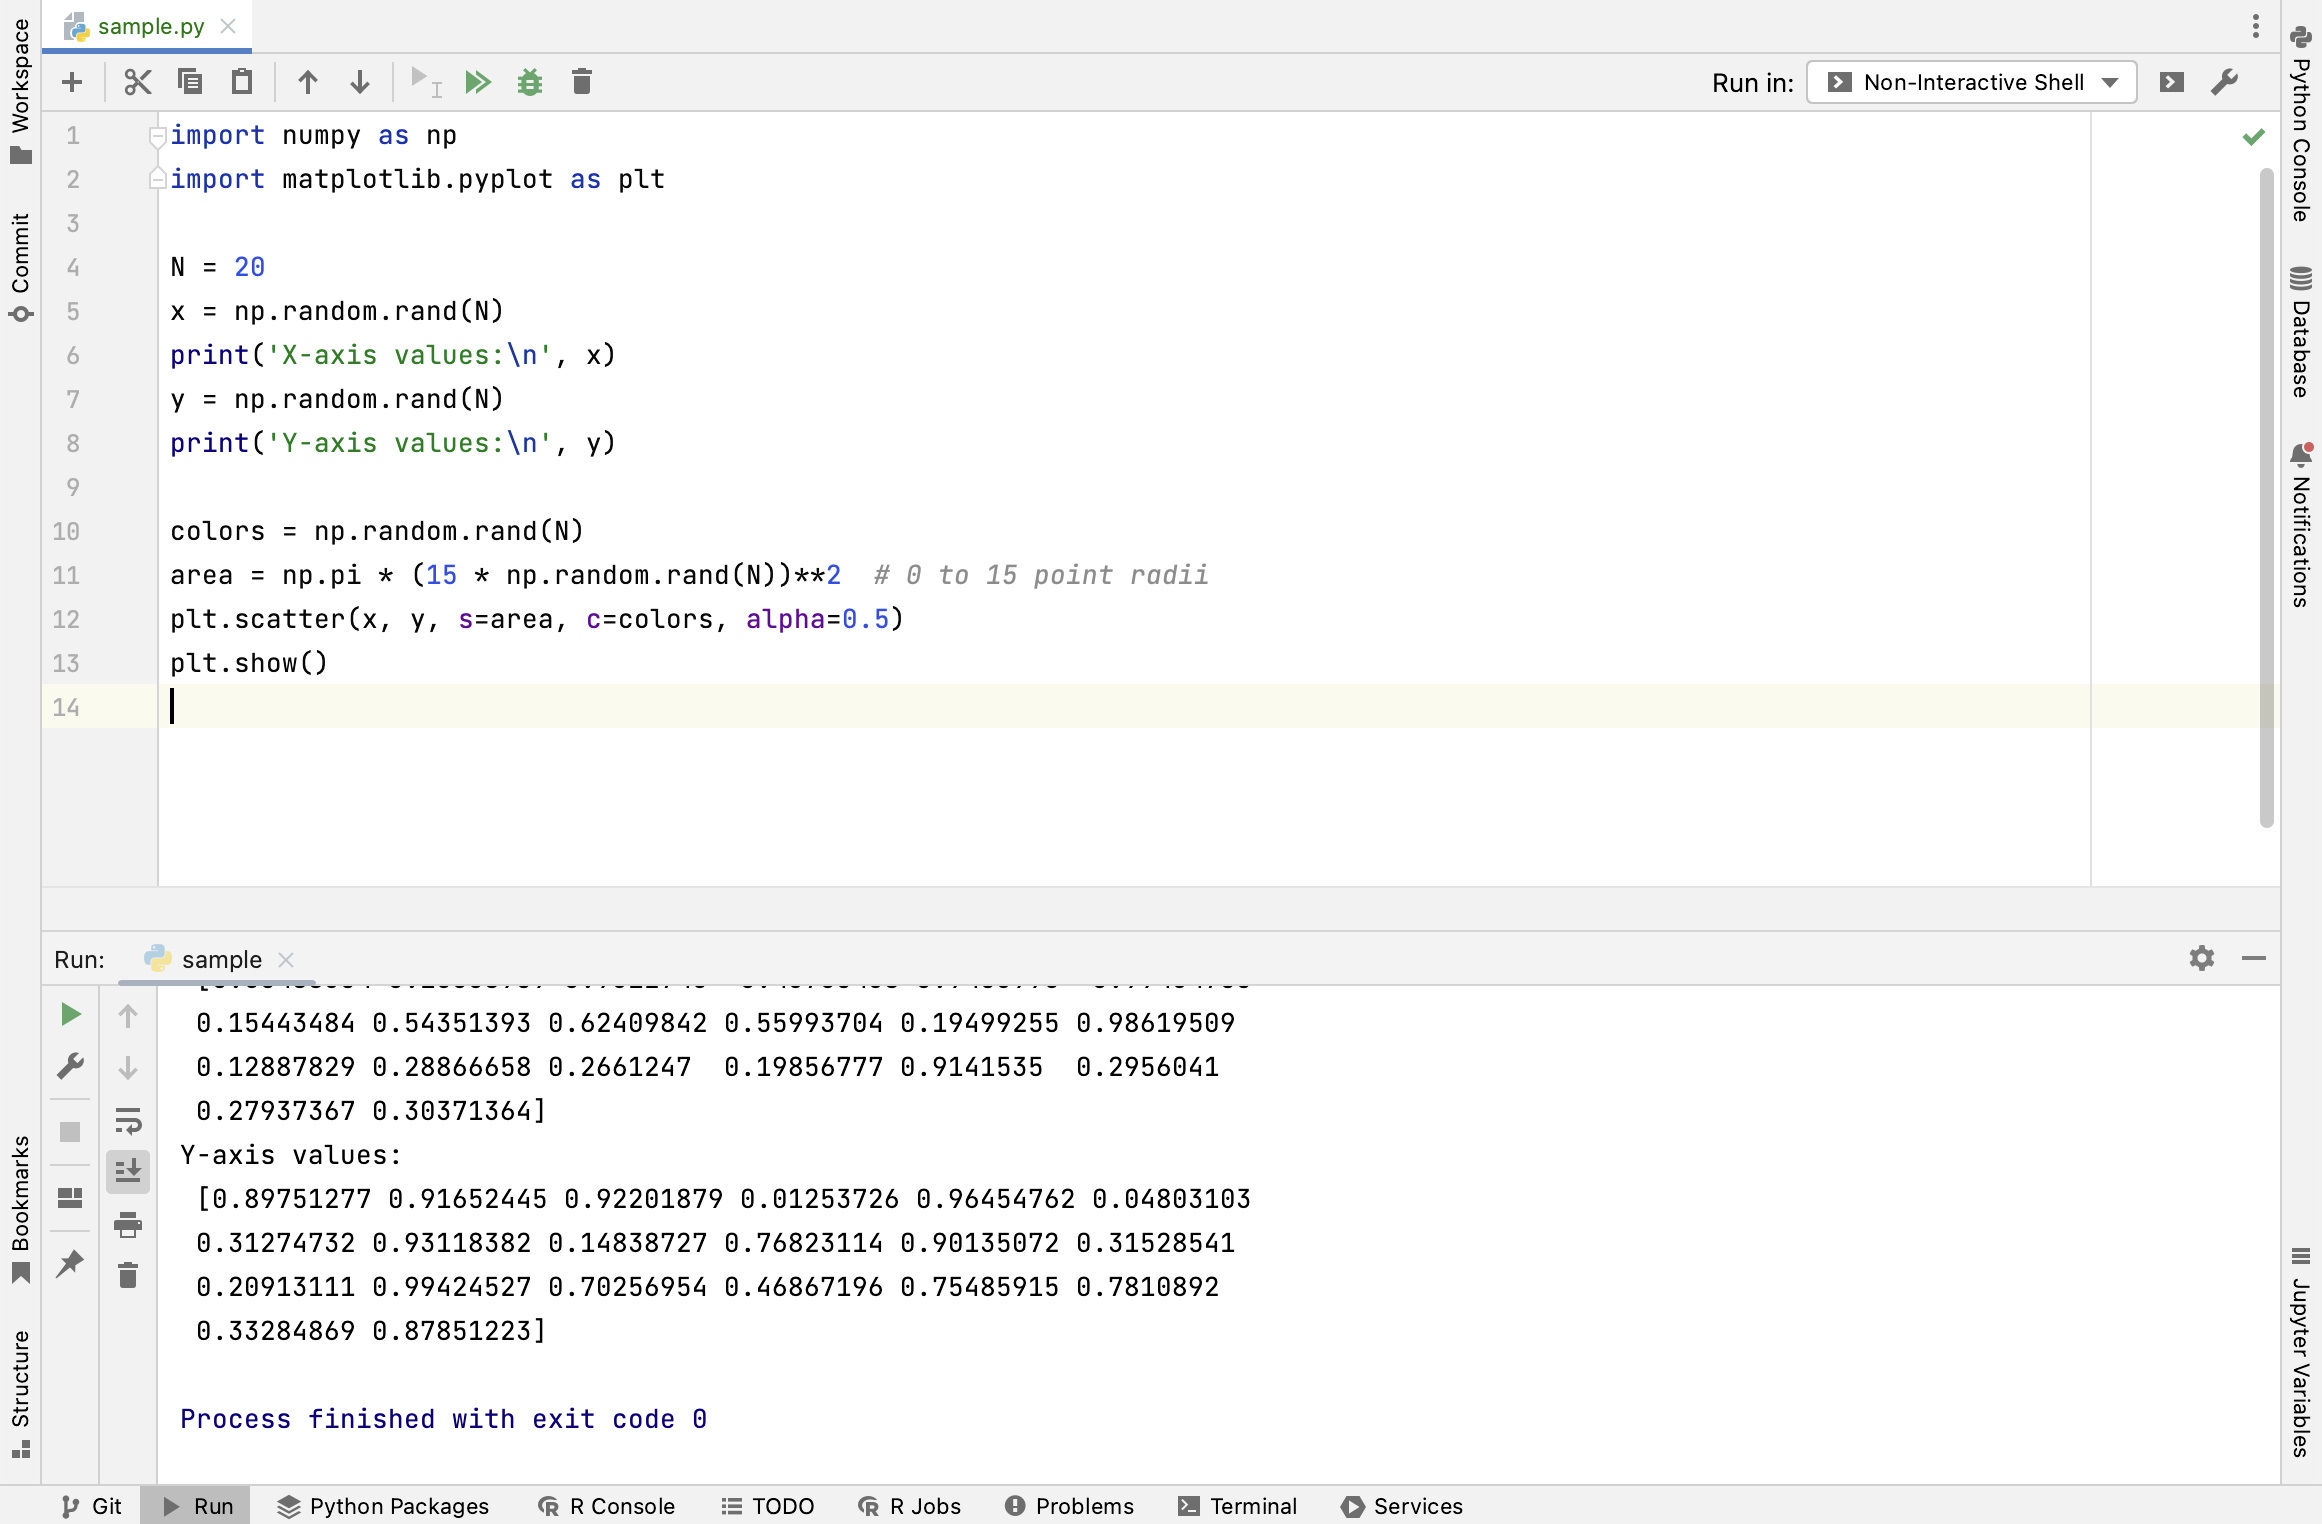
If the way you execute your Python script doesn't imply any interactivity, you can run it in a non-interactive console, similar to running code in the Run tool window.
Select Non-Interactive Shell from the list of controls and click
.
Run code cells
You can format your Python code as a set of executable cells to run each separately.
To split your code into cells, add
# %%lines where appropriate.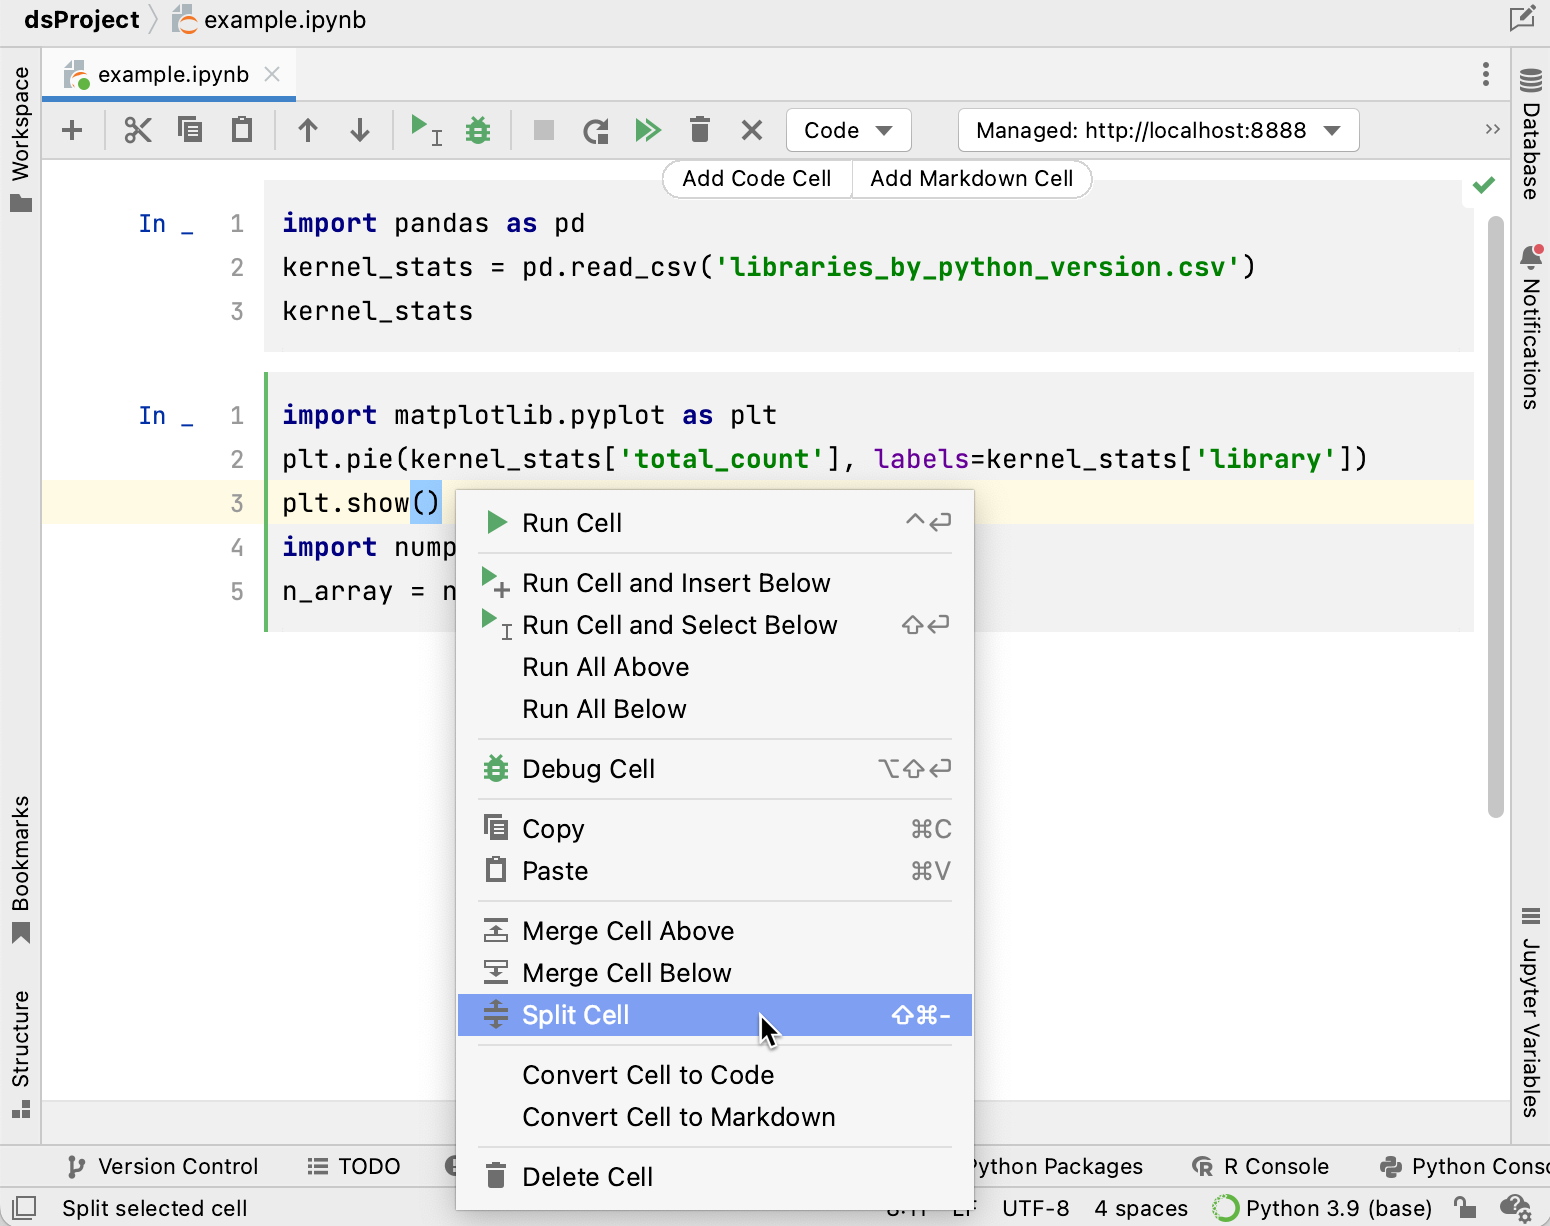
Each cell has a Run icon (
) in the gutter. Click it to execute a cell. Mind code dependencies and required imports. In the following example, the
kernel_statsvariable is defined in the first cell. So, running the second cell first results inNameError:
You can preview all commands executed in the current session of the selected Python console.
View console query history
Select a target console and click
on the console toolbar.
Preview the list of the executed commands in the history dialog:
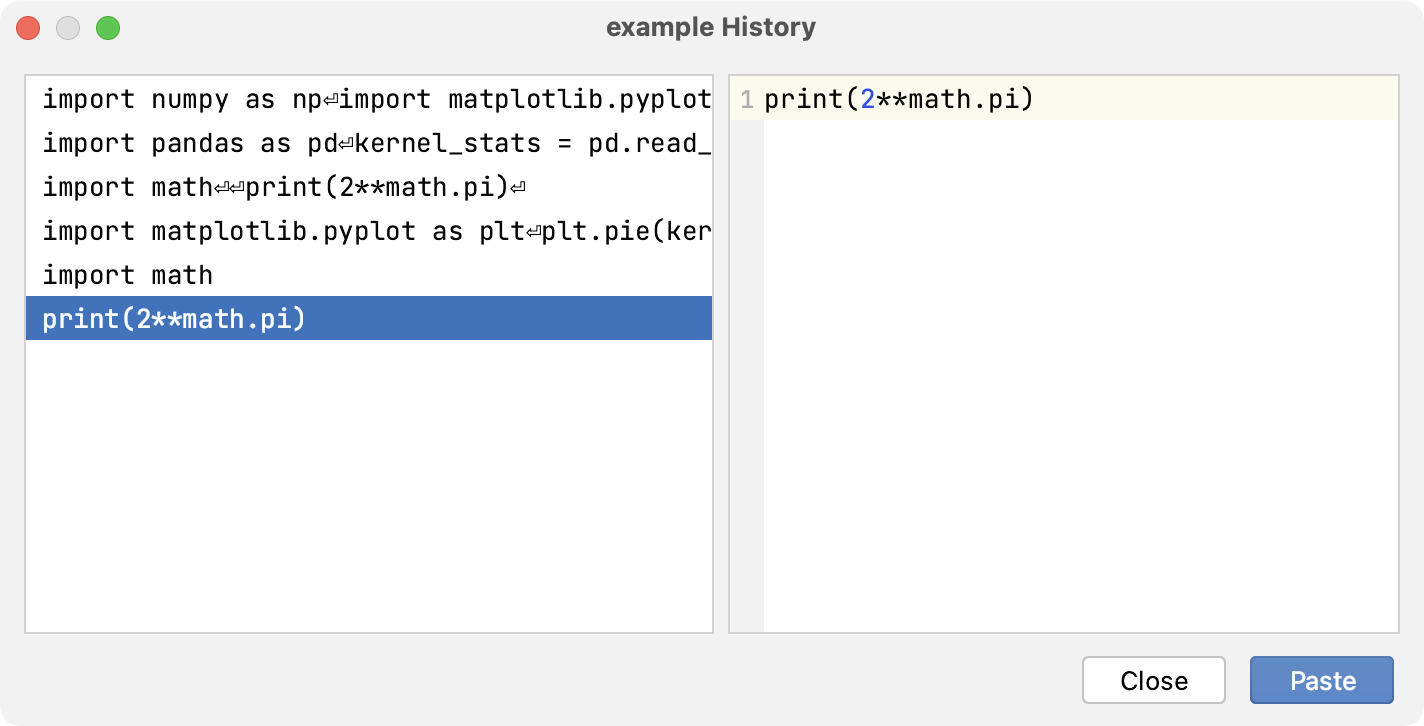
You can select any item in the list and click the Paste button to copy and paste the related commands into the current Python console
Once the commands are added, press Enter to execute them.
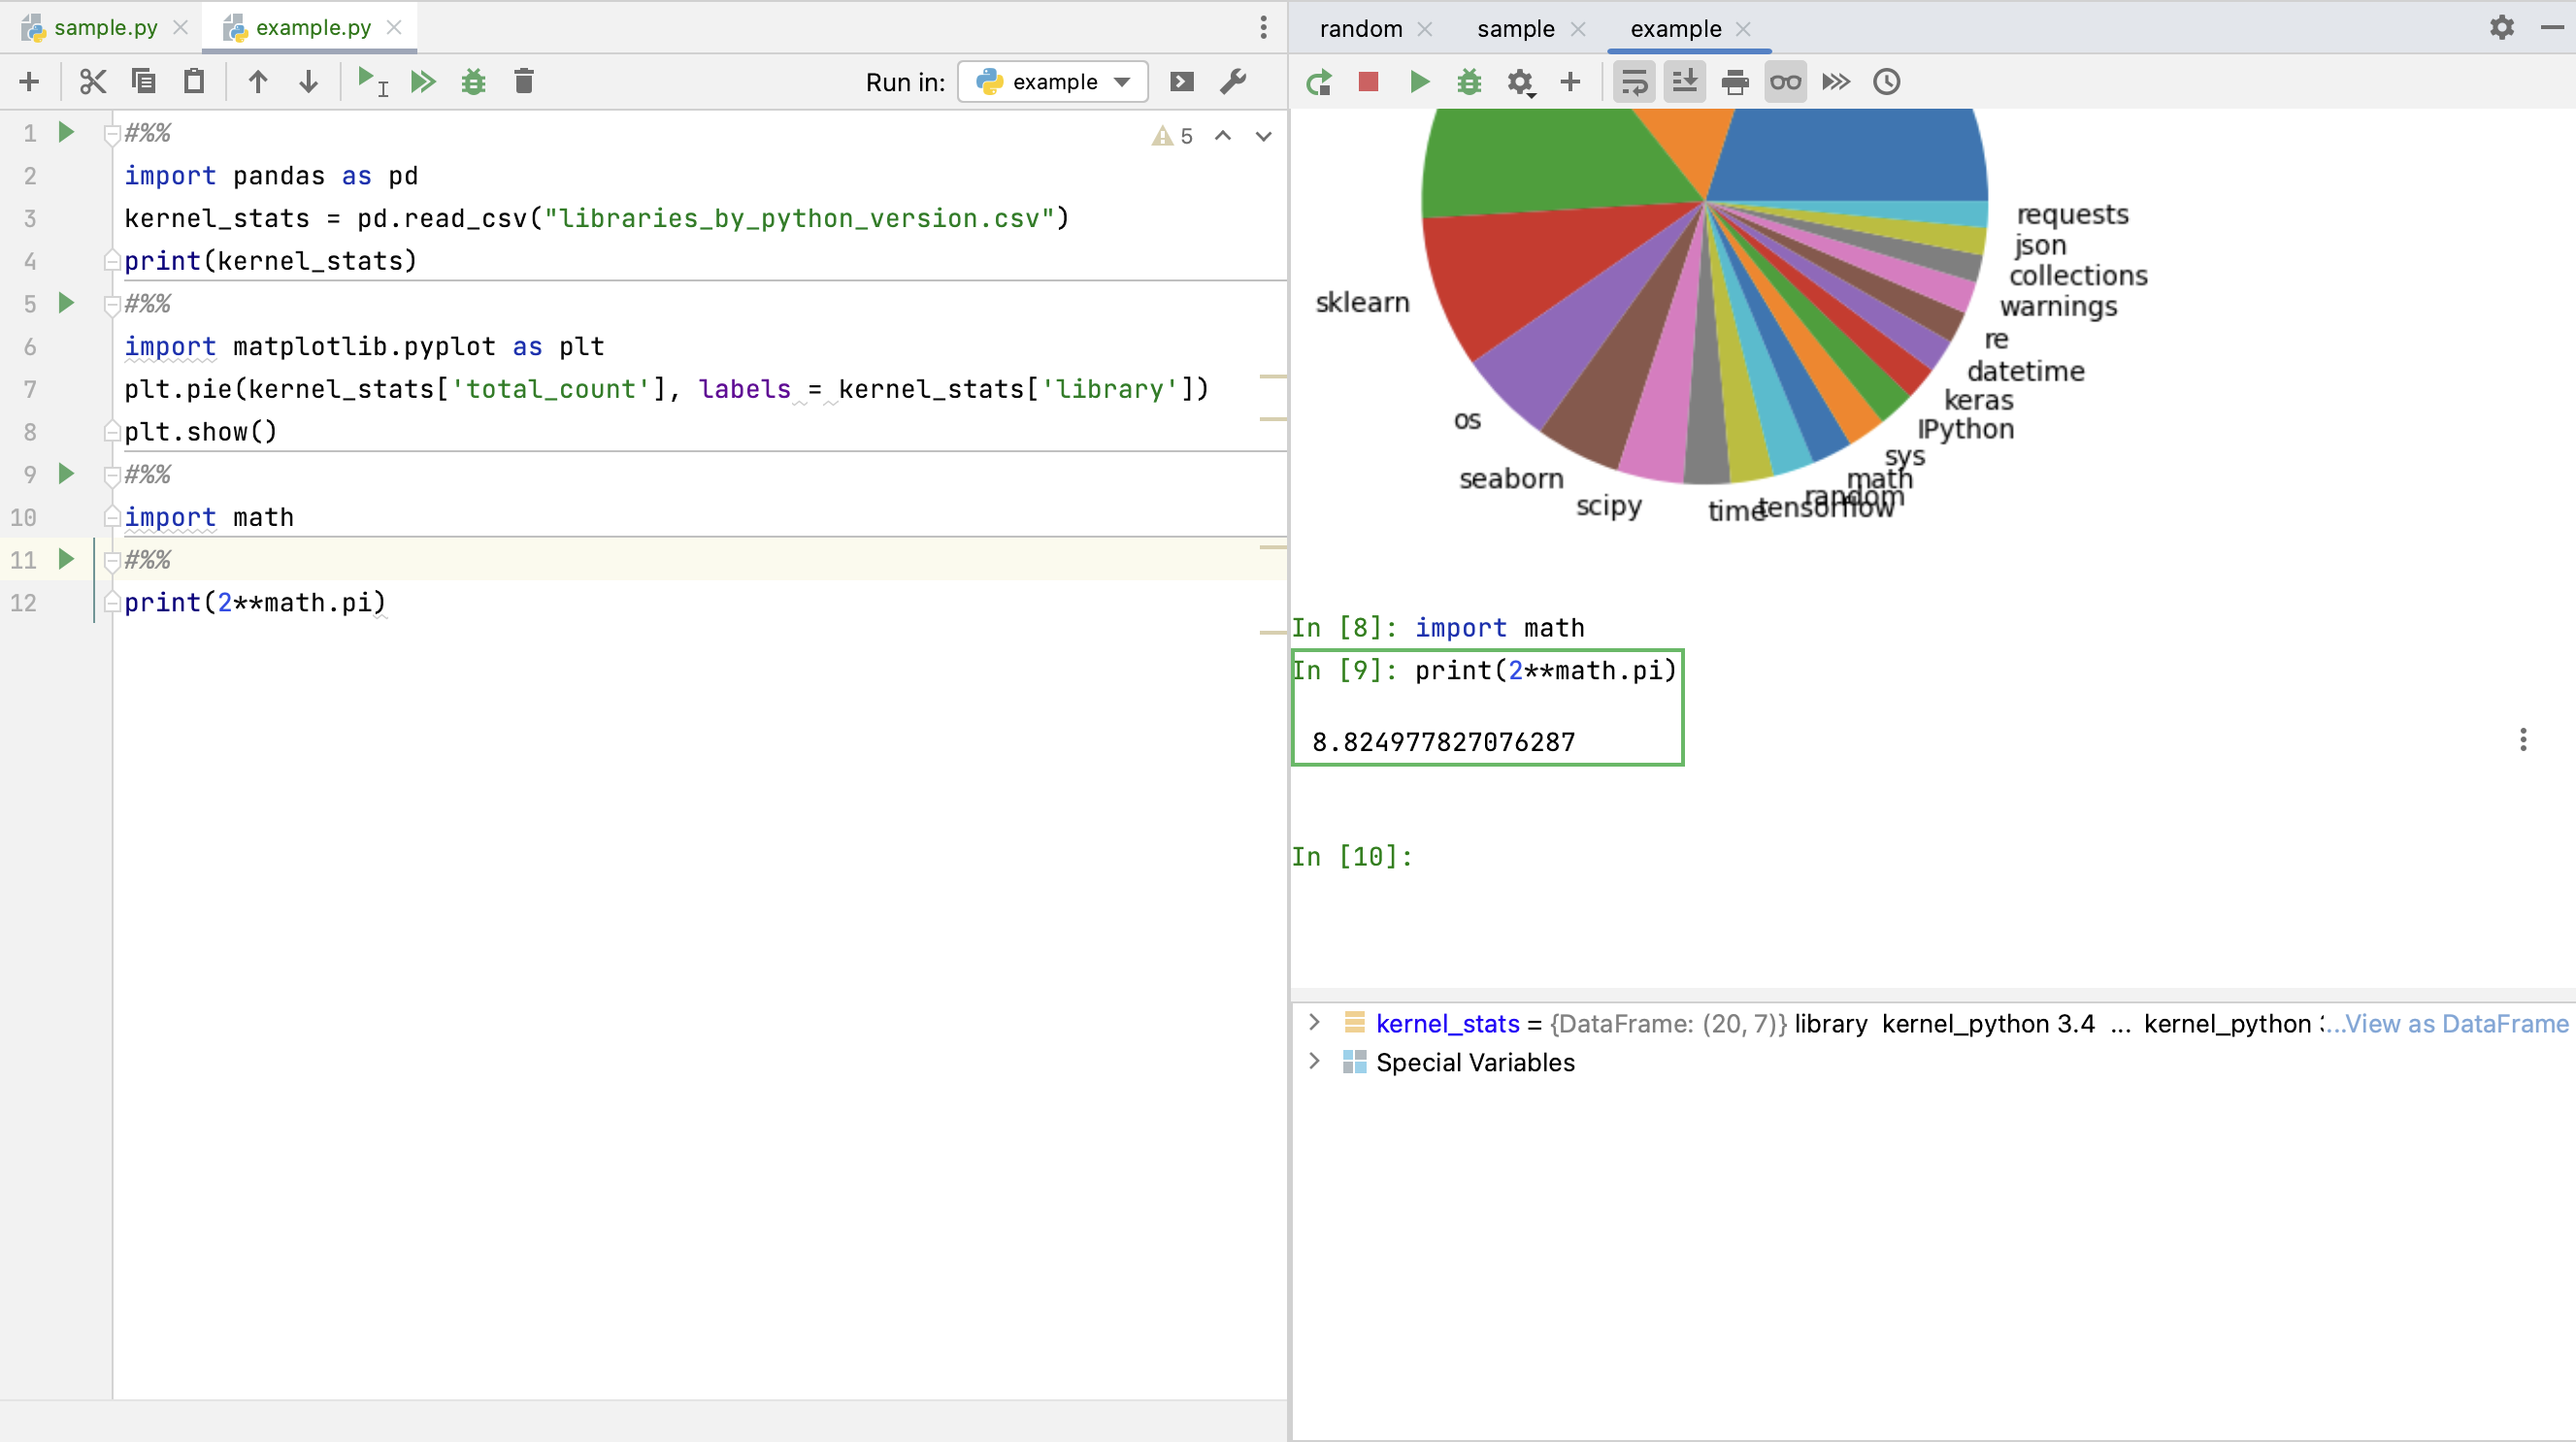
Use the Python Console toolbar to configure the way DataSpell present the execution output.
Python Console Toolbar
Item | Tooltip and shortcut | Description |
|---|---|---|
Rerun console Ctrl+F5 | Click this button to terminate the current process and launch the new one. | |
Stop Ctrl+F2 | Click this button to stop the current process. Clicking the button once invokes soft kill allowing the application to catch the | |
Execute Current Statement Enter. | Click this button to execute the command at caret, entered in the input pane of the console. | |
Attach Debugger | Attaches the debugger process to the console. | |
Settings | You can specify the following settings of the Python console:
| |
New Console | Click this button to start a new console session. | |
Use Soft Wraps | Click this button to toggle the soft wrap mode of the output. | |
Scroll to the end | Click this button to navigate to the bottom of the stack trace and have the cursor jump to the corresponding location in the source code. | |
Click this button to send the console text to the default printer. | ||
Show variables | Click this button to show in a separate pane the variables declared in the console. Right-click a variable in this pane reveals a context menu. | |
Show Command Queue | Click this button to preview the command execution queue. | |
| Browse History Ctrl+Alt+E | Open a dialog that shows all the statements that you have run for the corresponding data source. queries that you have run in the console. See also, Using the History dialog. |