User interface
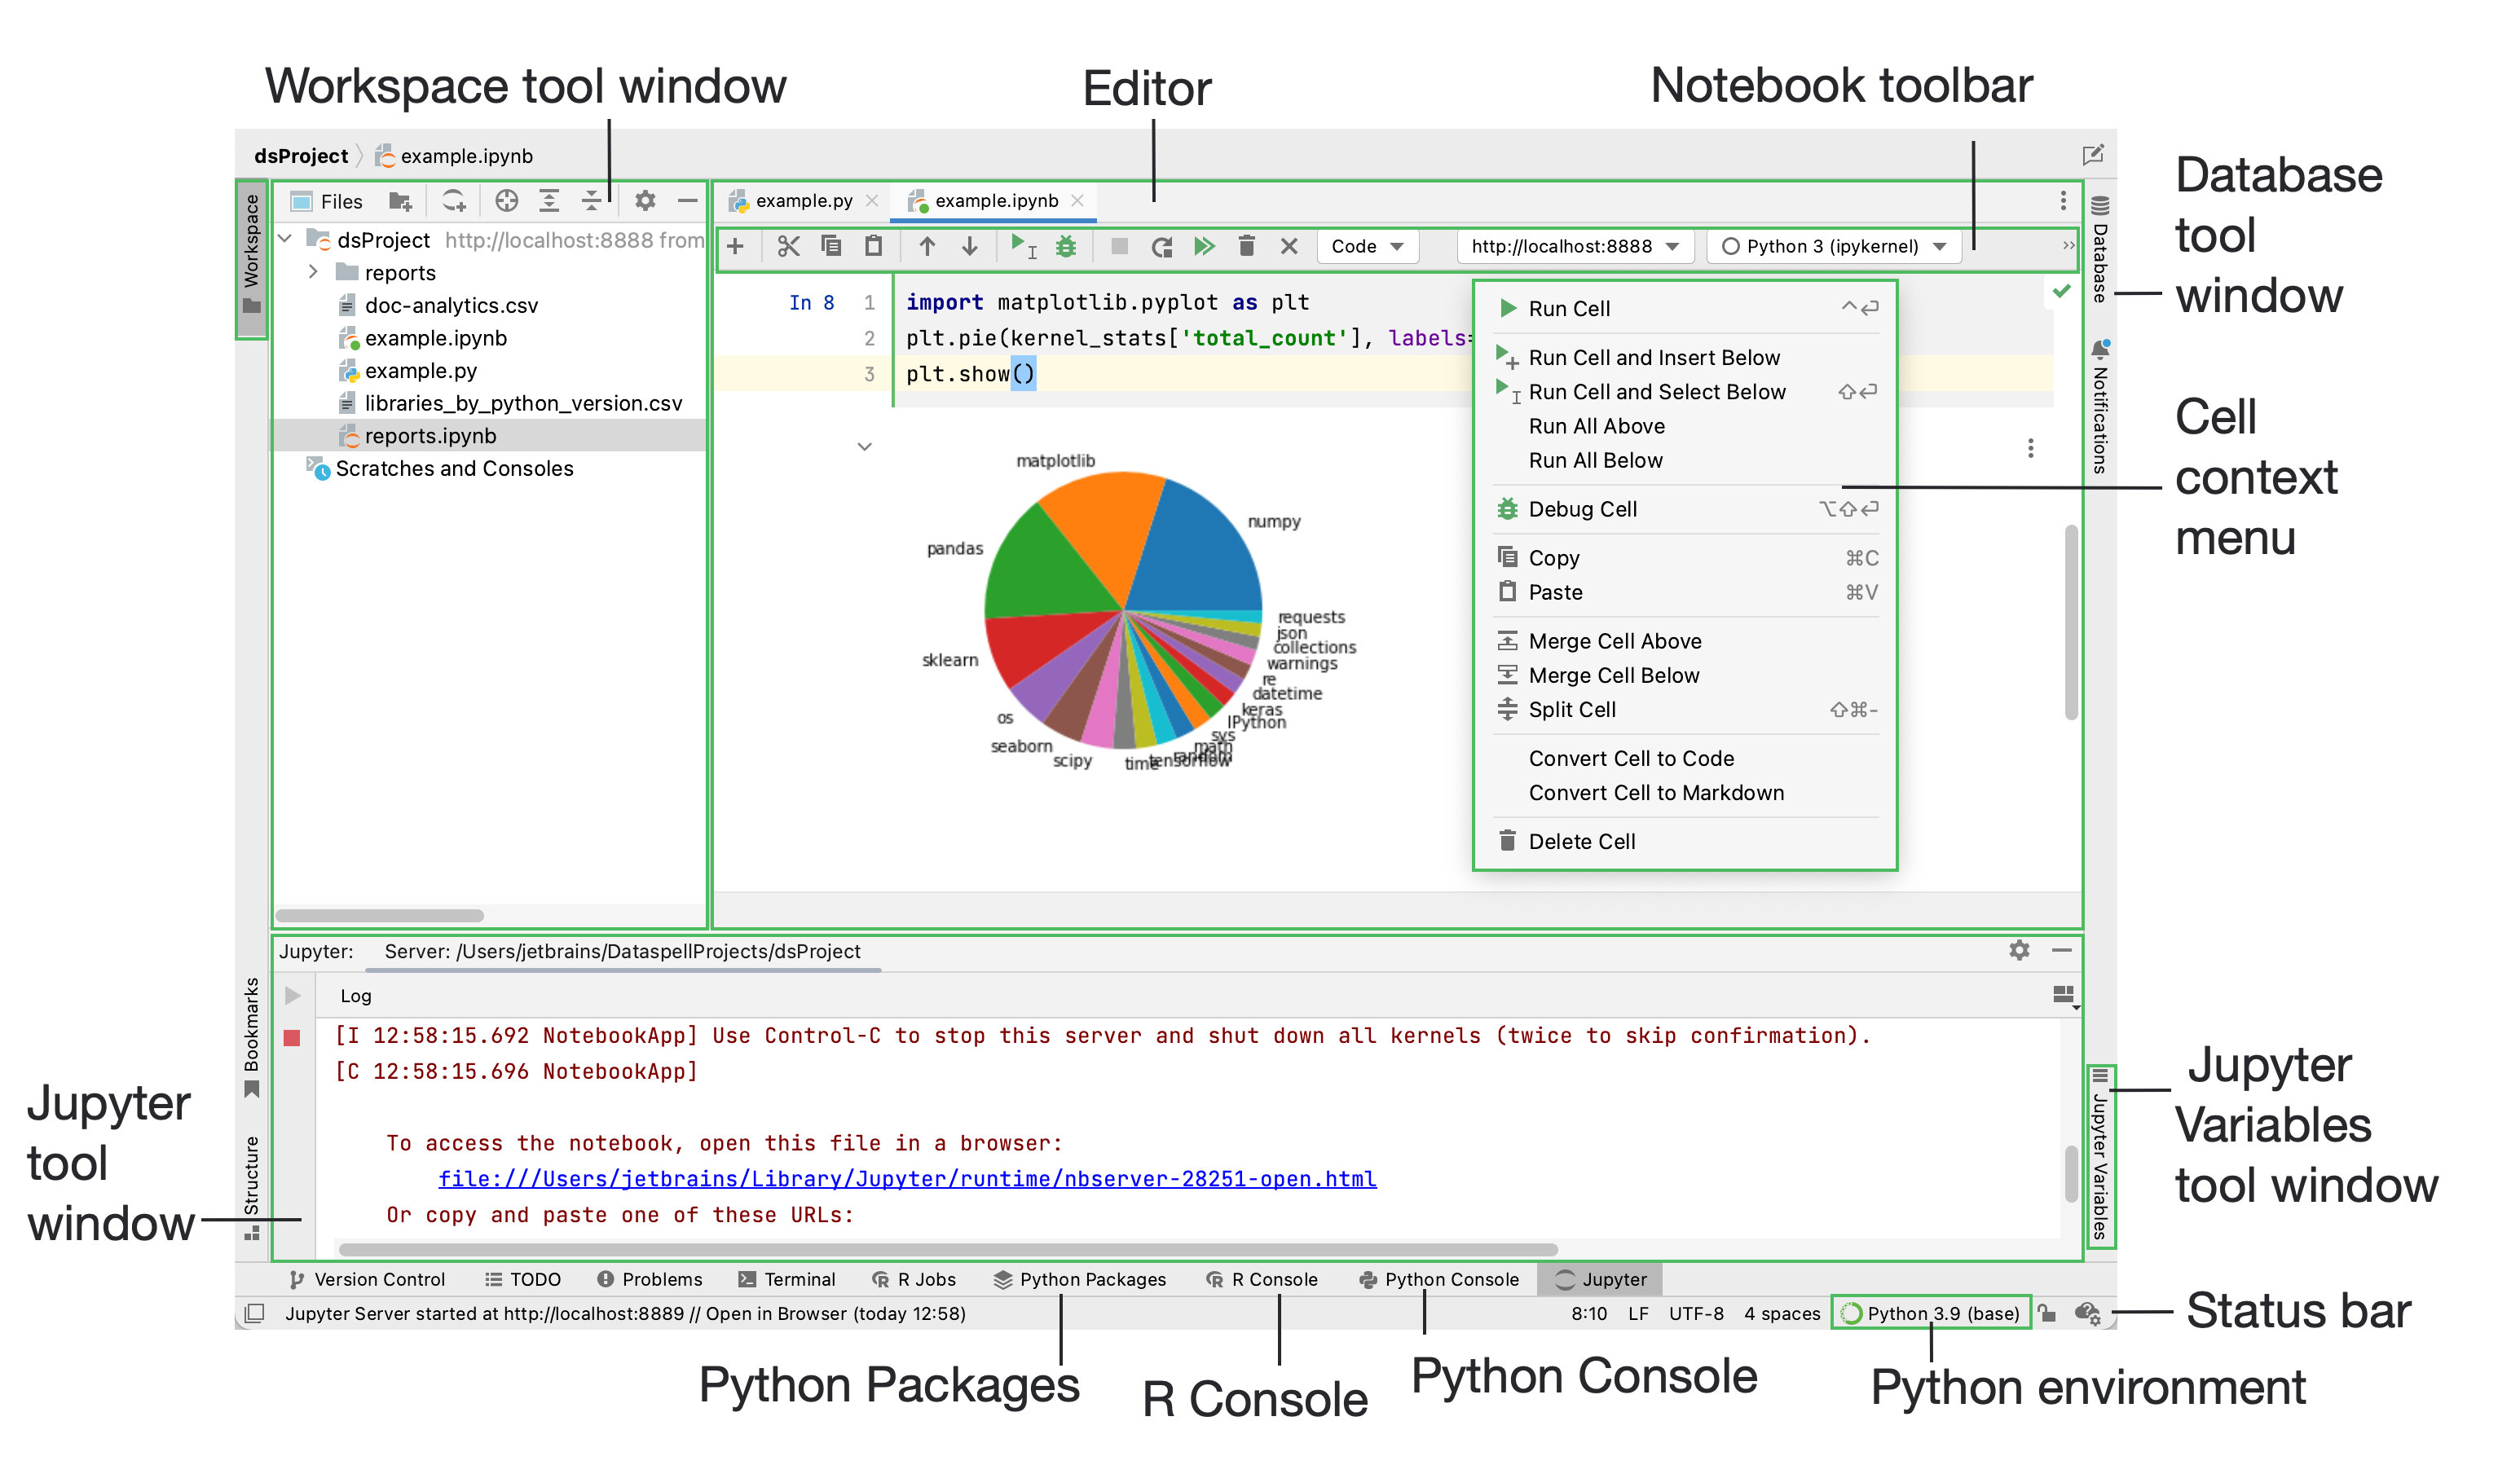
When you open a workspace directory in DataSpell, the default user interface looks as follows:

Depending on the set of plugins and configuration settings, your IDE may look and behave differently.
Editor
Focus: Escape
Use the editor to read, write, and explore your source code .
Navigation bar
Focus: Alt+Home
Show/hide:
The navigation bar at the top is a quick alternative to the Project view, where you can navigate the structure of your workspace directory and open files for editing.
Status bar
Show/hide:
The left part of the status bar at the bottom of the main window shows the most recent event messages and descriptions of actions when you hover over them with the mouse pointer. Click a message in the status bar to open it in the Notifications tool window. Right-click the message in the status bar and select Copy to paste the message text when you are searching for a solution to a problem or need to add it to a support ticket or to the DataSpell issue tracker.
The status bar also shows the progress of background tasks. You can click to show the Background Tasks manager.
The right part of the status bar contains widgets that indicate the overall project and IDE status and provide access to various settings. Depending on the set of plugins and configuration settings, the set of widgets can change. Right-click the status bar to select the widgets that you want to show or hide.
Widget | Description |
|---|---|
52:11 10:12 | Shows the line and column number of the current caret position in the editor. Click the numbers to move the caret to a specific line and column. If you select a code fragment in the editor, DataSpell also shows the number of characters and line breaks in the selected fragment. |
LF | Shows the line endings used to break lines in the current file. Click this widget to change the line separators. |
| Shows the encoding used to view the current file. Click the widget to use another encoding. |
Column | Indicates that the column selection mode is enabled for the current editor tab. You can press Alt+Shift+Insert to toggle it. |
| Click to lock the file from editing (set it to read-only) or unlock it if you want to edit the file. |
| The Python Interpreter selector. It shows the Python interpreter that currently is in use. |
| If version control integration is enabled, this widget shows the current VCS branch. Click it to manage VCS branches. |
| Shows the indent style used in the current file. Click to configure the tab and indent settings for the current file type or disable indent detection in the current project. |
| Shows the amount of memory that DataSpell consumes out of the total amount of heap memory. |
Tool windows
Show/hide:
The Jupyter tool window shows the status of the current connection and provides access to the variables of the executed notebook. The Server tab appears when you have any of the Jupyter server launched. It shows the current state of the Jupyter server and the link to the notebook in a browser. The Variables tab provides the detailed report about variable values of the executed cell.
The Structure tool window displays the structure of a file currently opened in the editor and having the focus, or selected in the Workspace tool window. In Jupyter notebooks, you can navigate through the Markdown cell headers.
By default, tool windows are docked to the sides and bottom of the main window. You can arrange them as necessary, undock, resize, hide, and so on. Right-click the title of the tool window or click in the title for its arrangement options.