Set up environment and load data
This tutorial will guide you through the first steps in data science. You will learn how to set up a working environment in DataSpell, load a data set, and create a Jupyter notebook.
Prerequisites
Before you start, make sure that:
You have installed DataSpell. This tutorial was created in DataSpell 2022.2.1.
You have Python 3.6 or newer on your computer. If you're using macOS or Linux, your computer already has Python installed. You can get Python from python.org.
Set up data science environment
Let's start with running DataSpell.
To run DataSpell, find it in the Windows Start menu or use the desktop shortcut. You can also run the launcher batch script or executable in the installation directory under bin.
Run the DataSpell app from the Applications directory, Launchpad, or Spotlight.
Run the dataspell.sh shell script in the installation directory under bin. You can also use the desktop shortcut if it was created during installation.
When you run DataSpell for the very first time, it suggests configuring an environment for the default workspace. Conda is the recommended option, as it has Jupyter and data science libraries (like pandas) available out of the box.
If you have any Conda environment installed on your machine, DataSpell will suggest it. If no Conda has been detected, you'll be provided with the Conda download link, so that you can download and install it first.
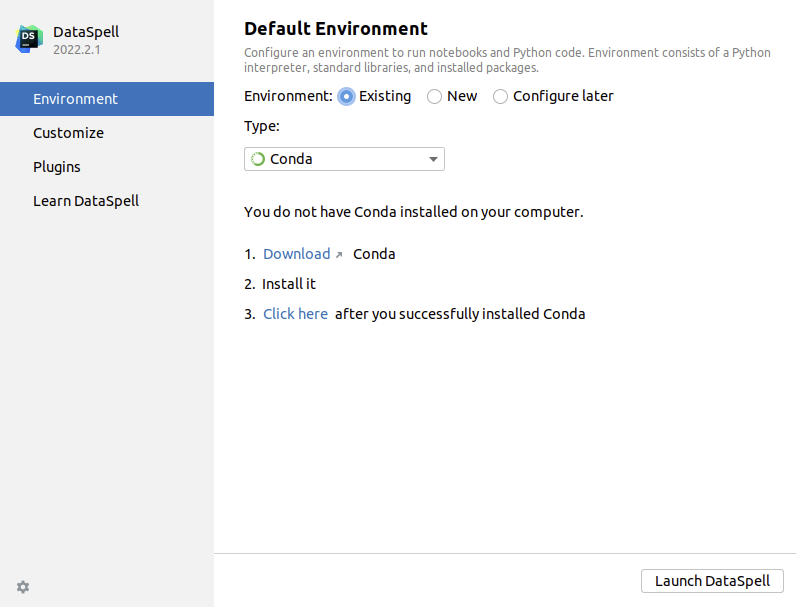
For more information about DataSpell initial setup, refer to Run DataSpell for the first time. When you are ready, click Launch DataSpell.
In DataSpell, you can see all your notebooks and other work-related files in the workspace. You can attach existing directories or create them. Let's create one for our project.
Create a directory in the workspace
Click
in the Workspace tool window.
Specify the location and click
to create a new directory.
Specify the location and click New Folder to create a new directory.
Specify the location and click
to create a new directory.
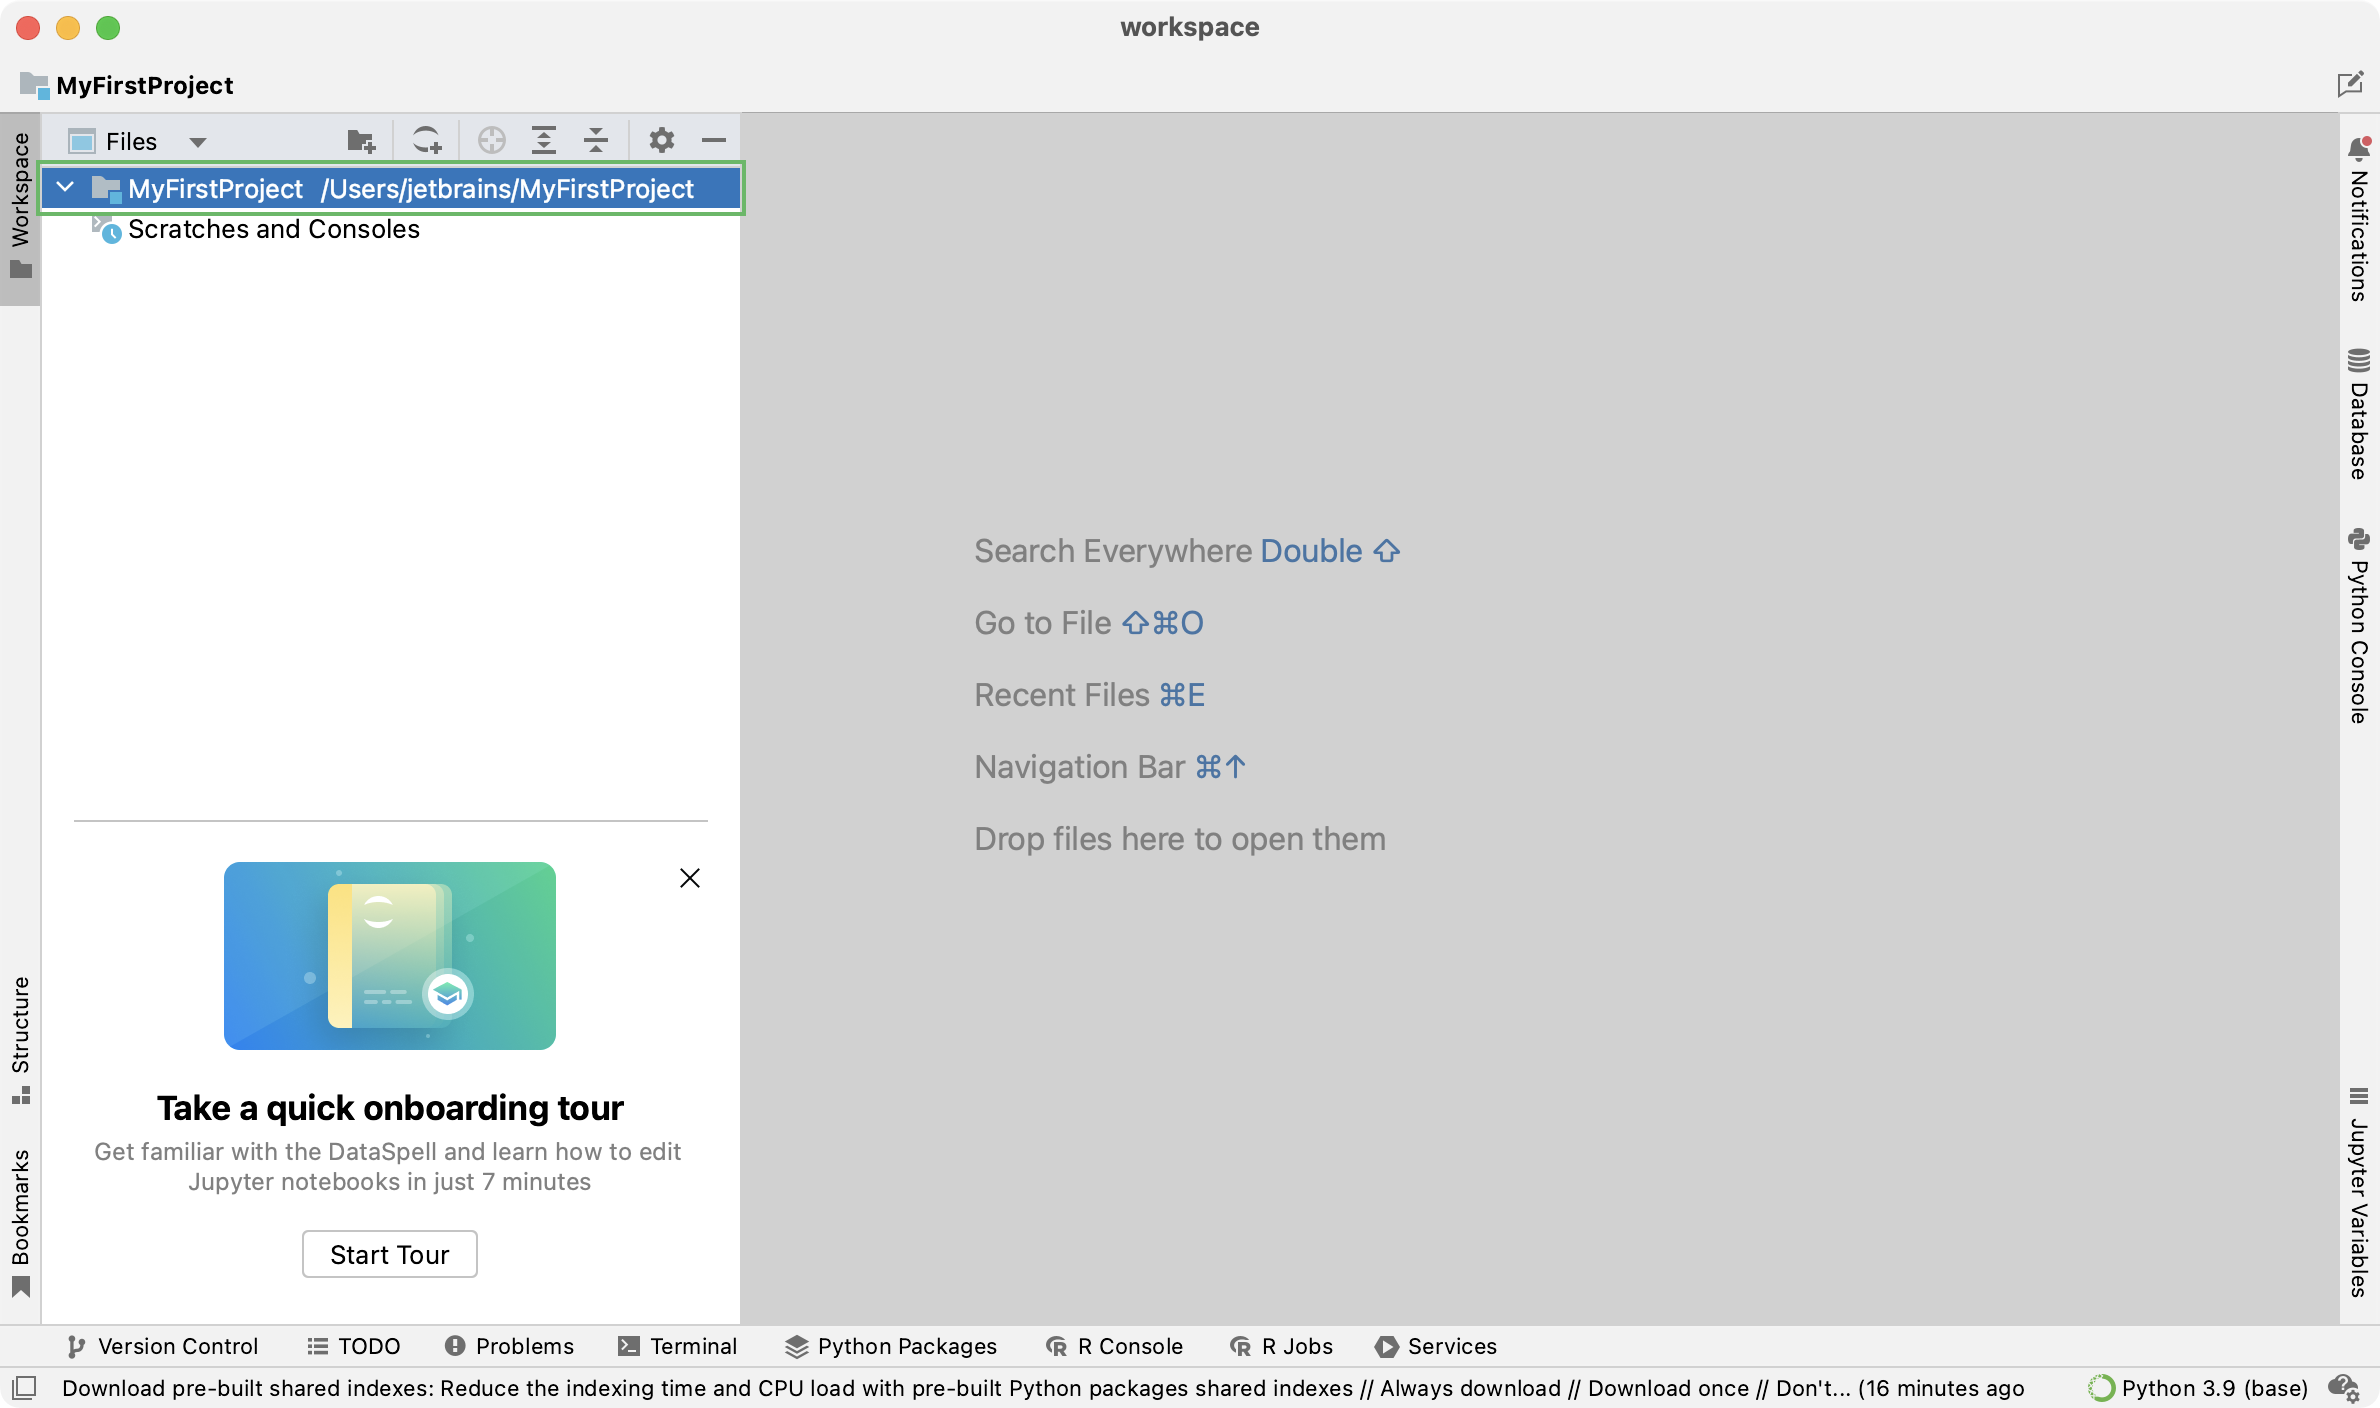
The directory appears in the Workspace tool window:
Prepare data
Now it's time to get some data for research. In this tutorial, we will use the "Airline Delays from 2003-2016" dataset by Priank Ravichandar licensed under CC0 1.0. This dataset contains the information on flight delays and cancellations in the US airports for the period of 2003-2016.
We will load the data, analyze it, and find out which airport had the highest ratios of delayed and cancelled flights.
Add data to the workspace
Download the dataset from kaggle.com by using the Download link in the upper-right corner.
Extract airlines.csv from the archive and drag-and-drop it to the folder in your DataSpell workspace.
Click Refactor to confirm the operation:

Now airlines.csv is shown in the Workspace tool window. You can open it in the editor:
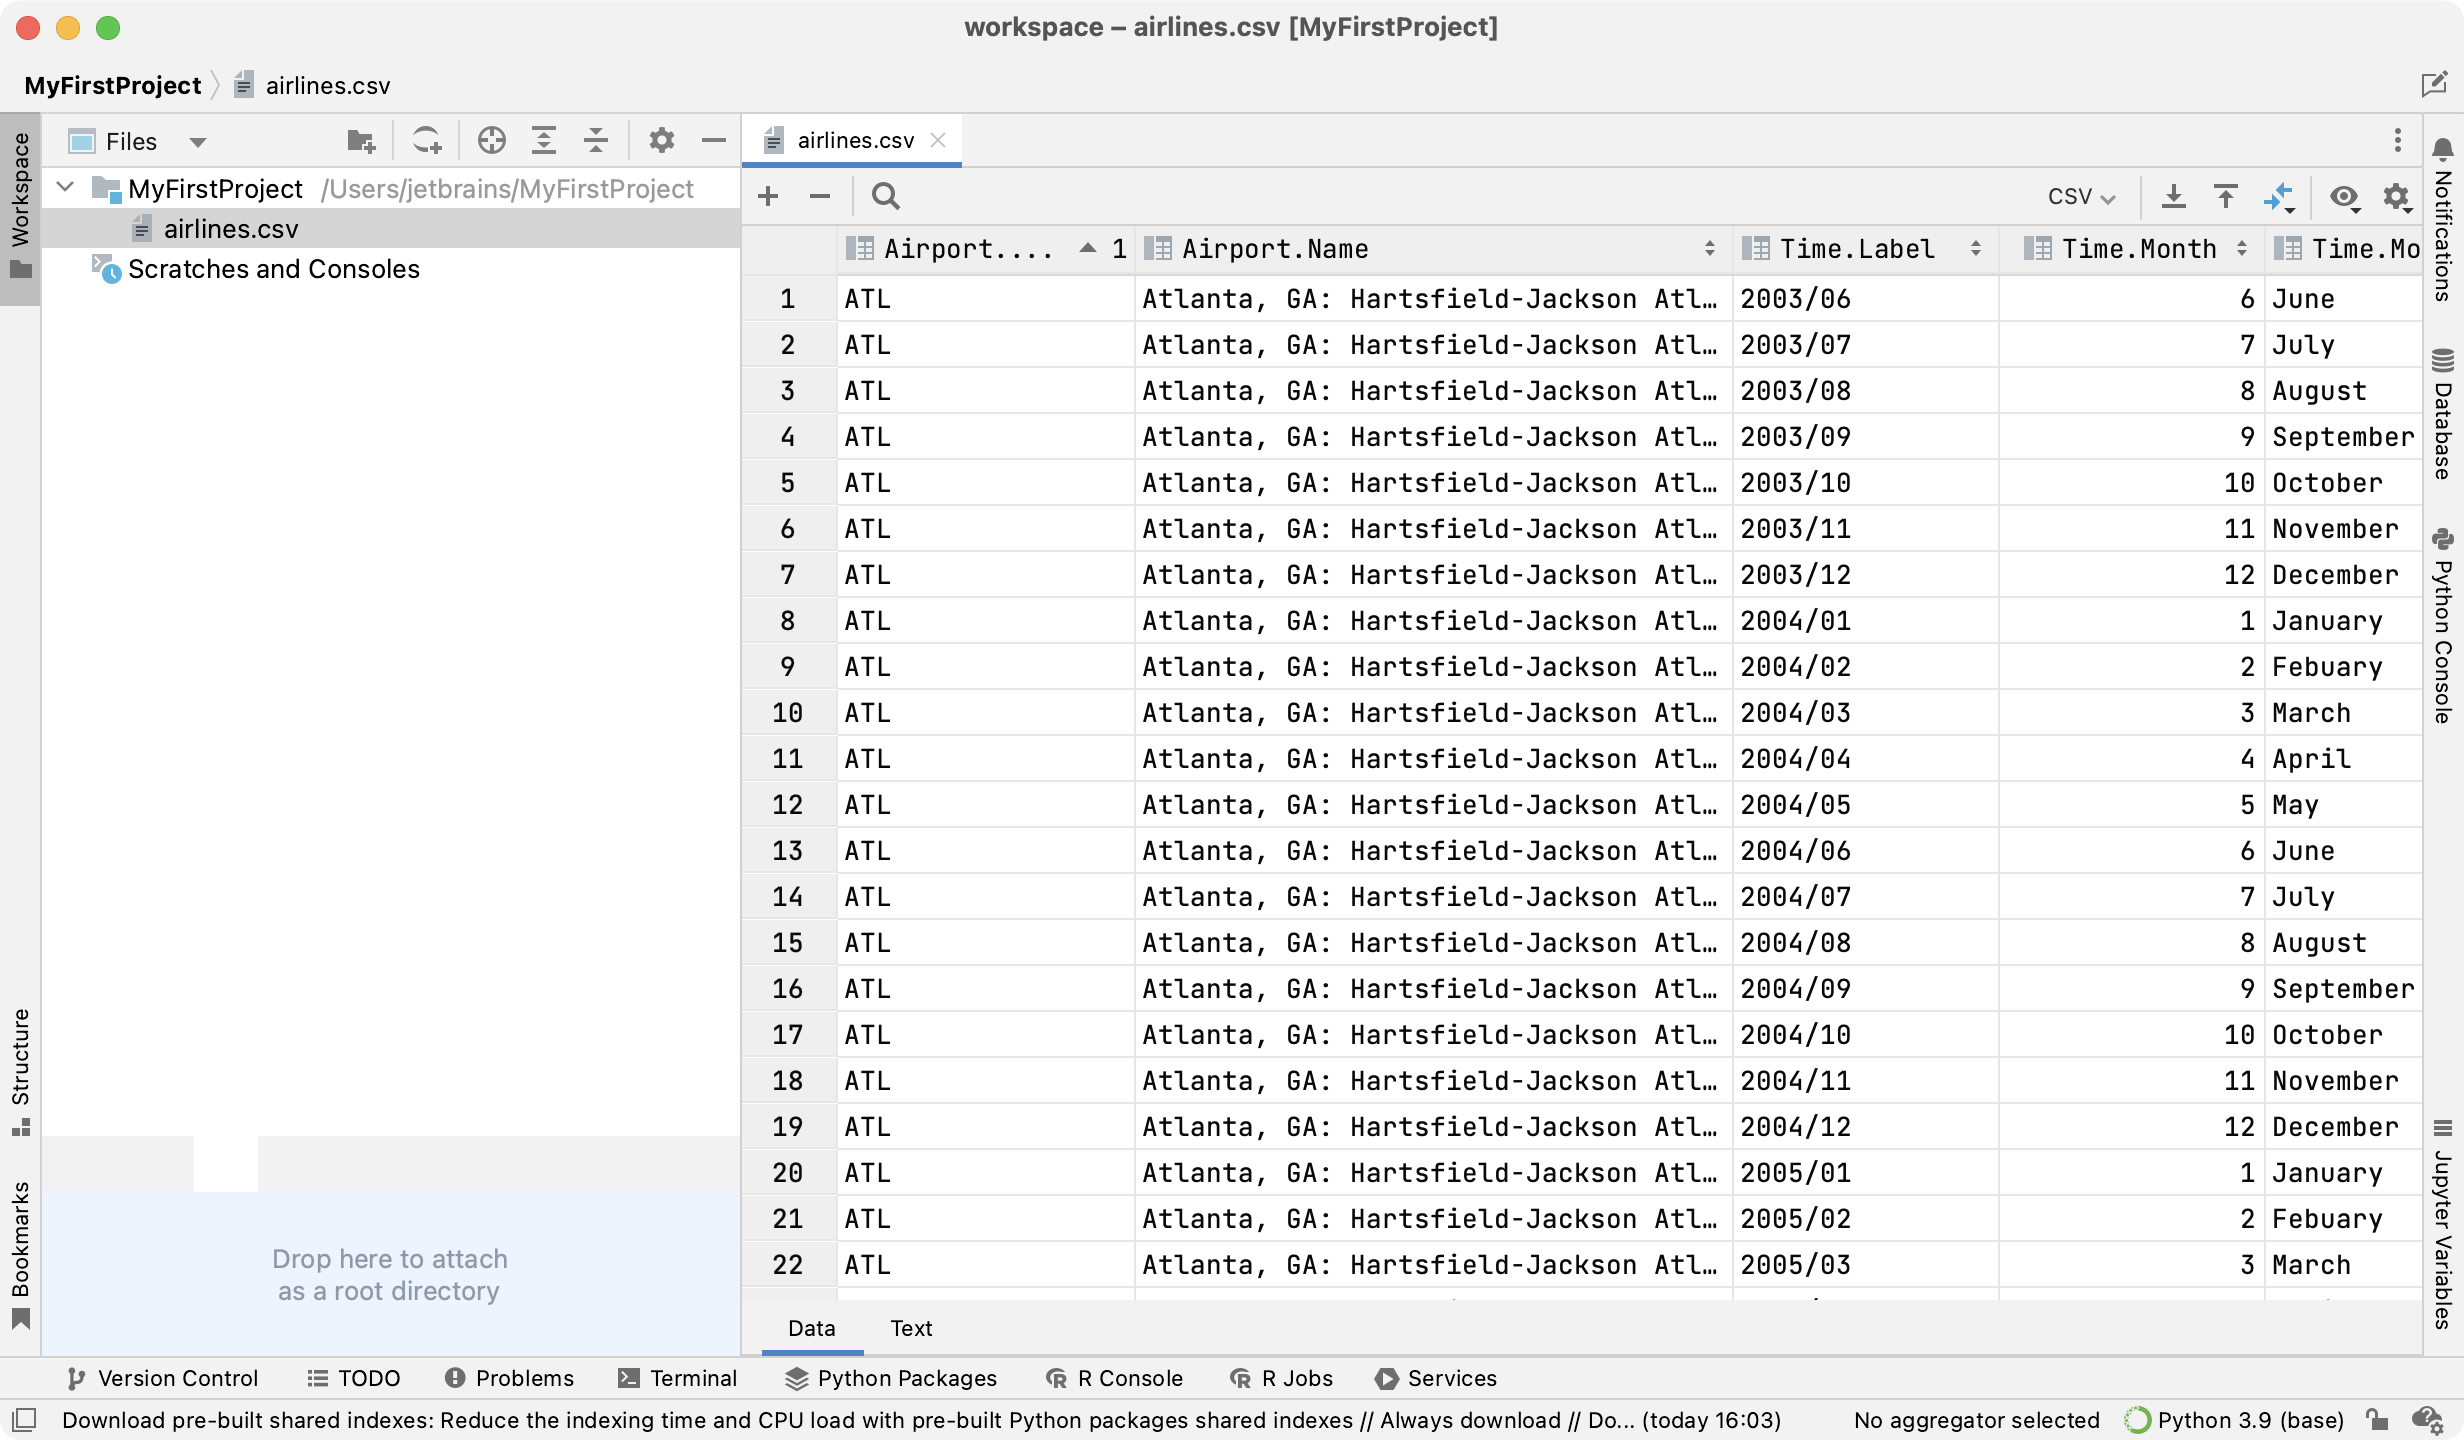
Let's create a Jupyter notebook:
Create a notebook file
Do one of the following:
Right-click the target directory in the Workspace tool window, and select New from the context menu.
Press Alt+Insert
Select Jupyter Notebook.
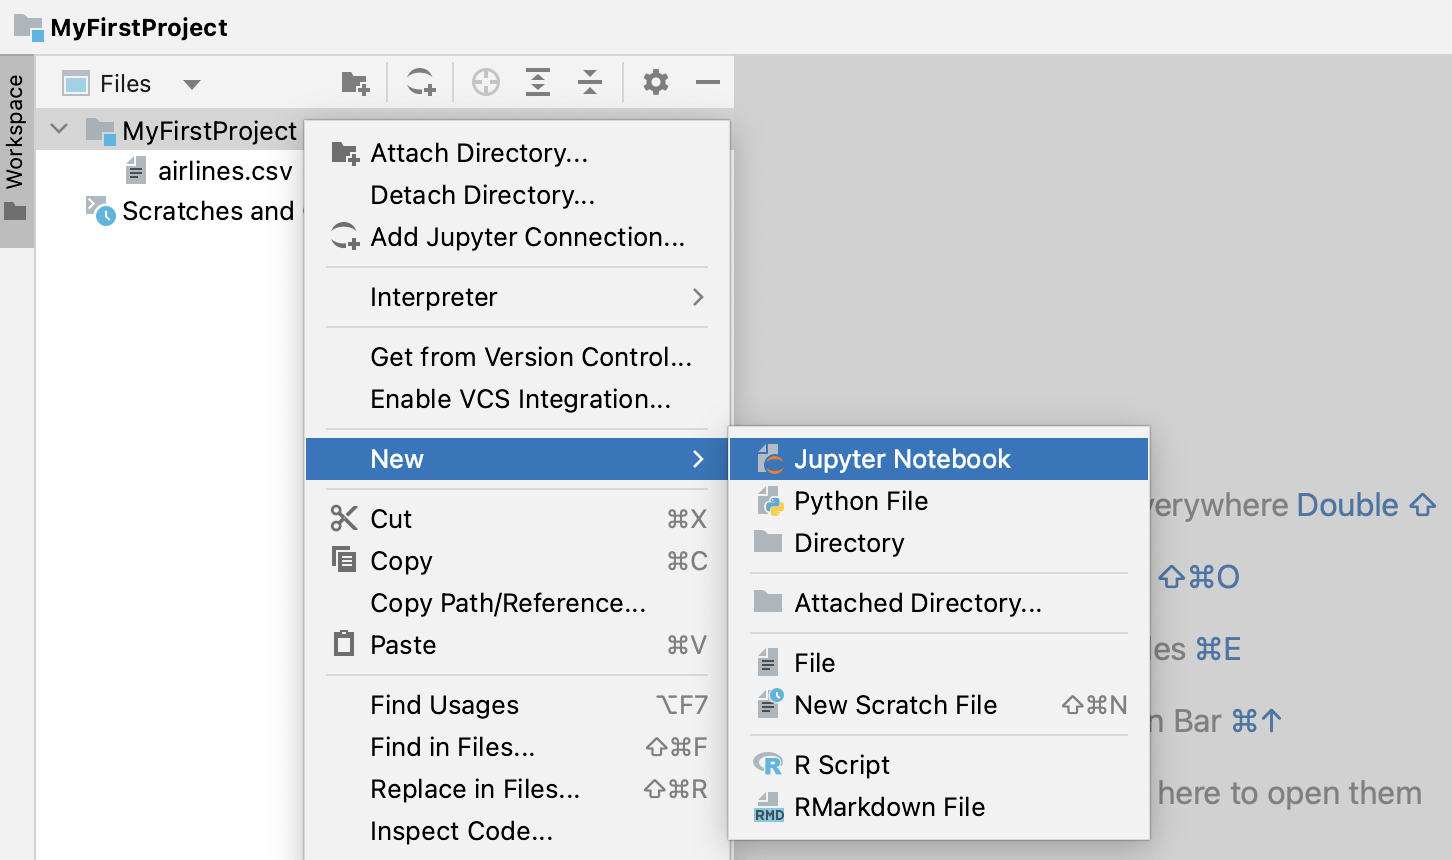
In the dialog that opens, type a filename.
A notebook document has the *.ipynb extension and is marked with the corresponding icon.
The newly created notebook contains one empty cell:
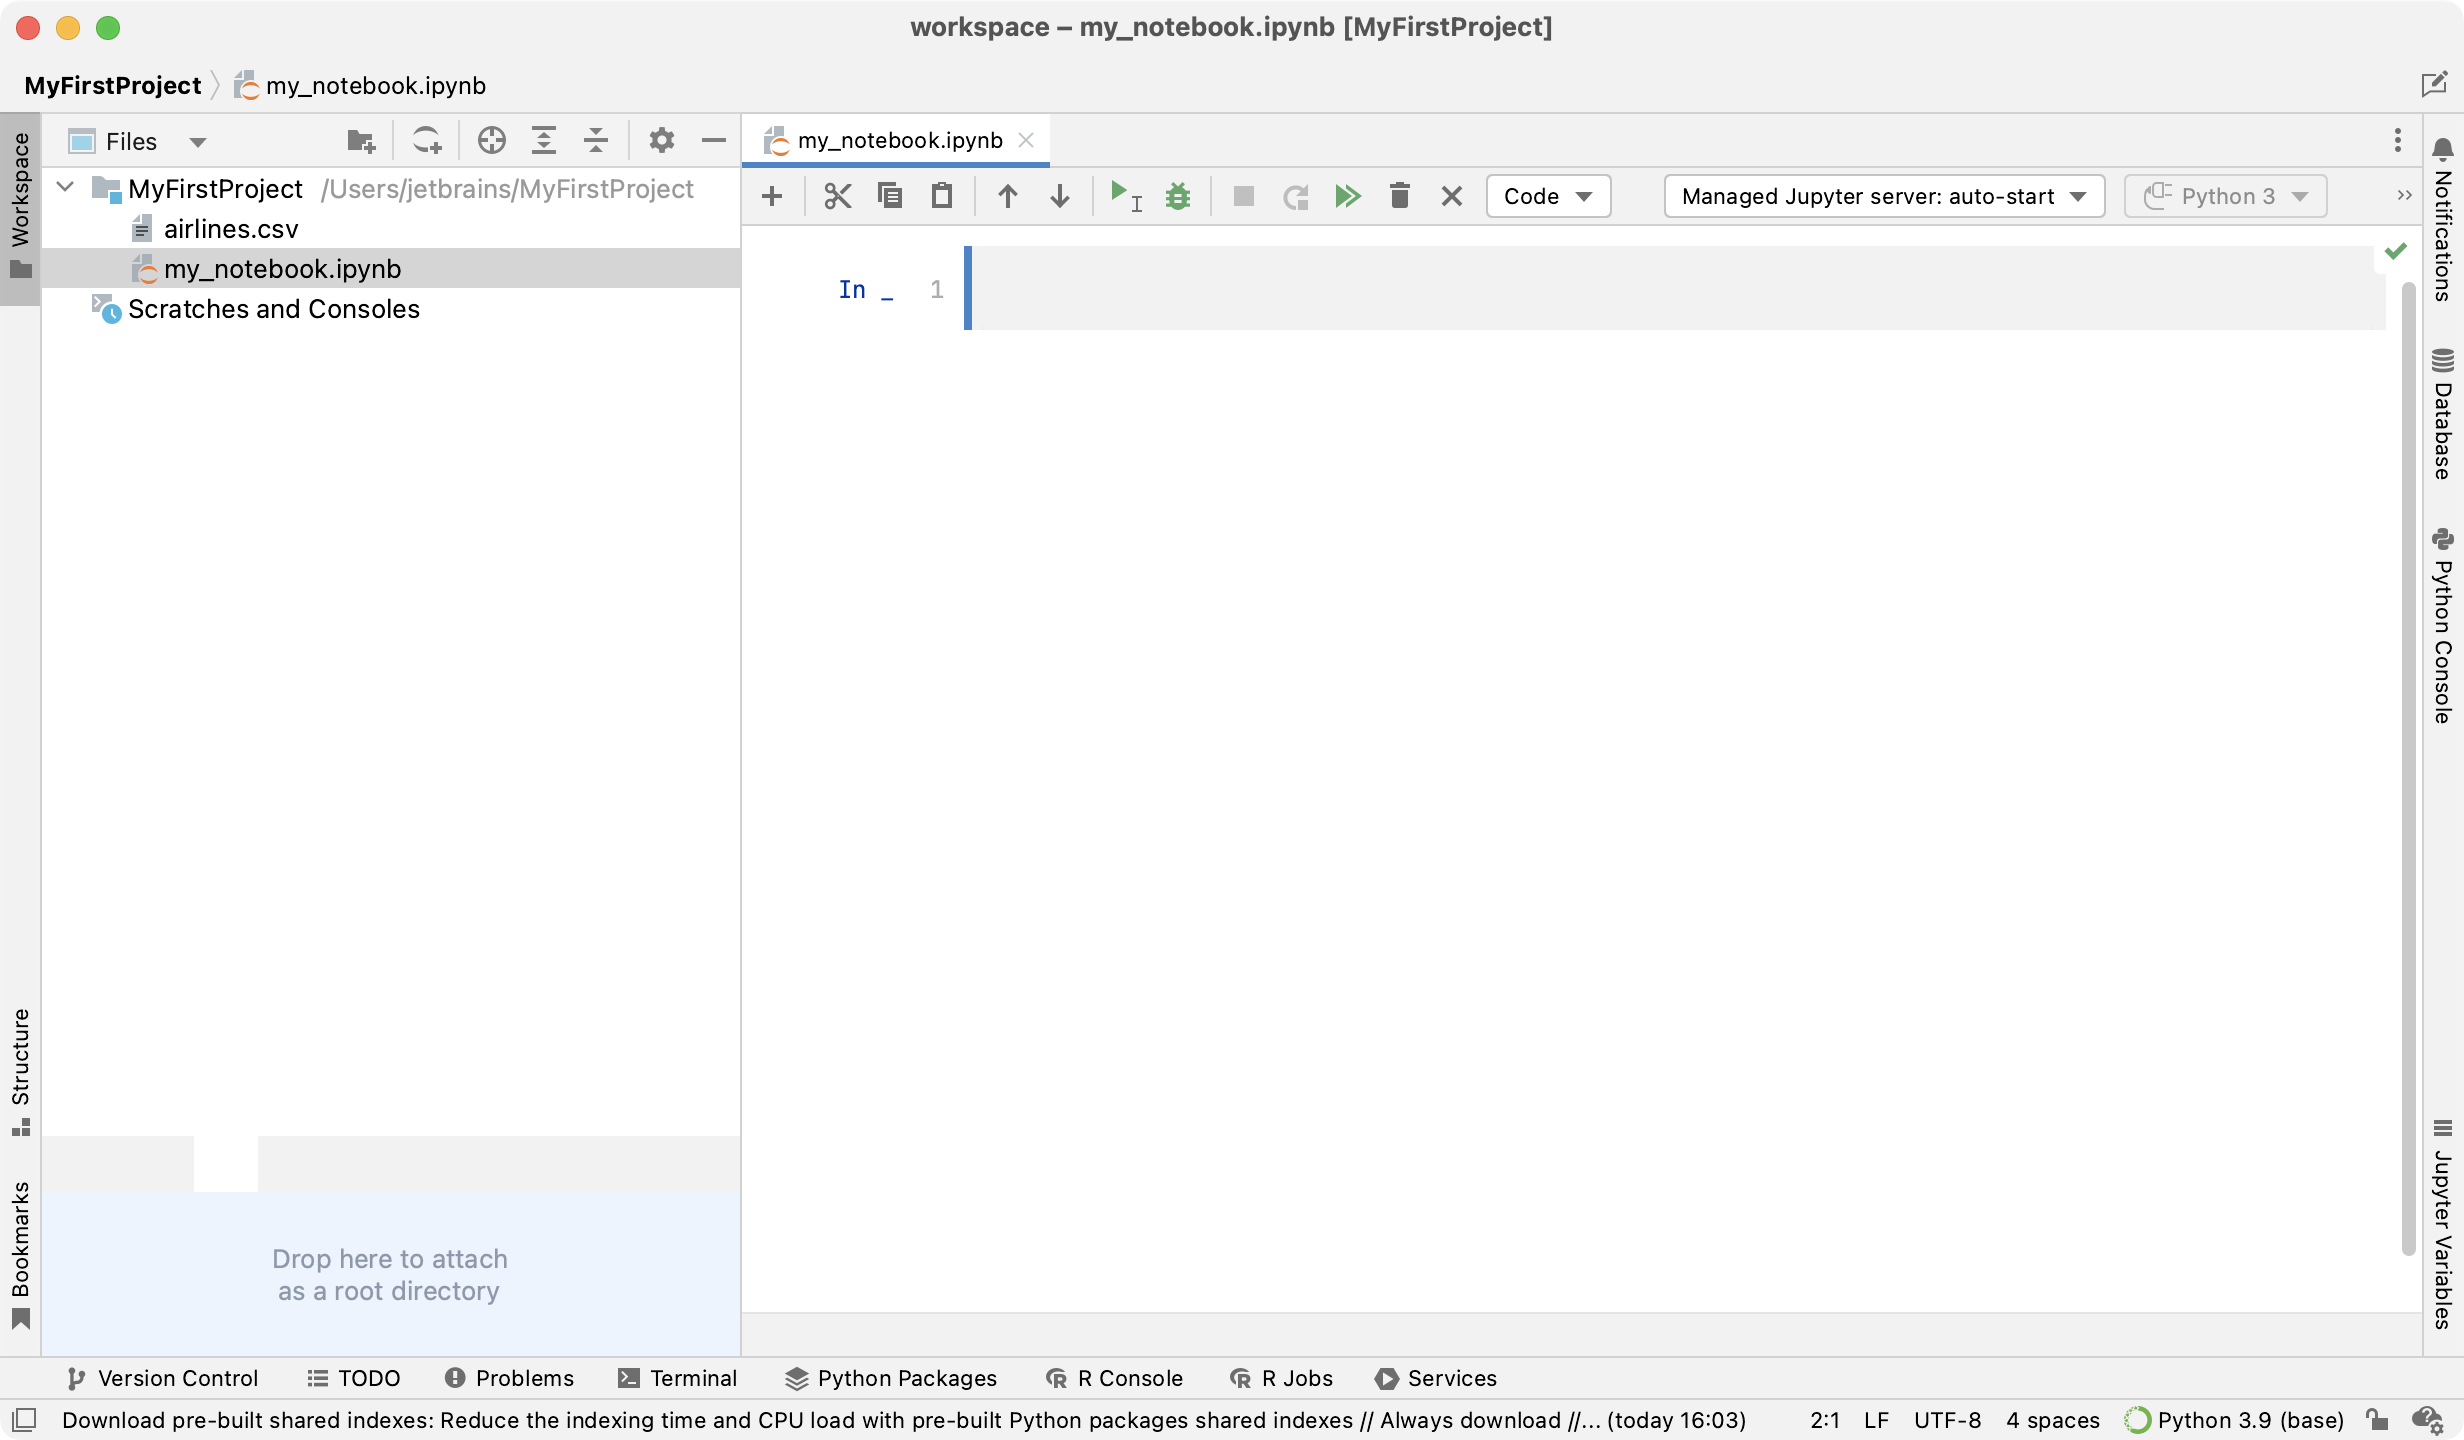
Now let's import the pandas library and load airlines.csv. Click inside the notebook cell and type the following code:
If you see the following warning, you can either click the first link to use the system interpreter, or choose to configure a Python interpreter for your project (see "Creating a new virtual environment " for details):
![]()
Let's run the notebook. There are several ways to do that:
To execute all code cells in your notebook, click
on the notebook toolbar.
To run just the current cell, press Ctrl+Enter.
When executing one cell at a time, mind code dependencies. If a cell relies on some code in another cell, that cell should be executed first.
Depending on the environment that you've chosen during the initial setup, you may need to install Jupyter:

If there is a red curvy line under pandas, it means that this package isn't available in your environment:
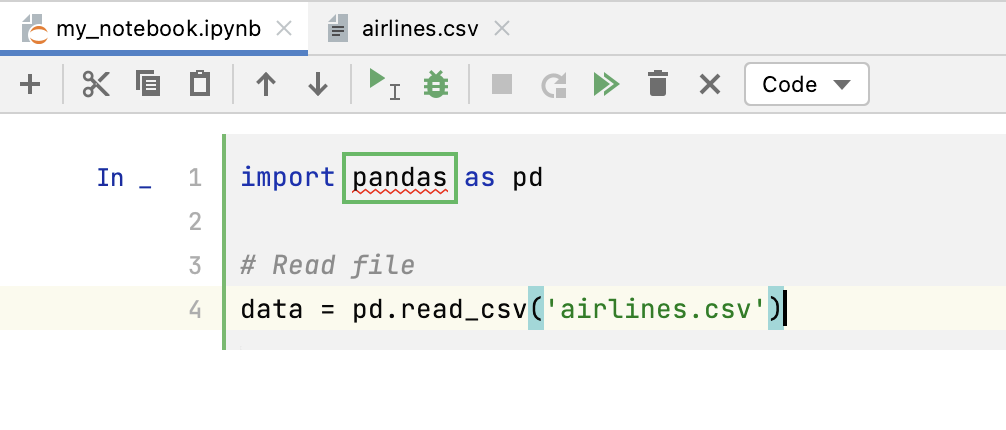
Place the caret at the highlighted expression and press Alt+Enter to reveal the list of available quick fixes. Choose to install the package:
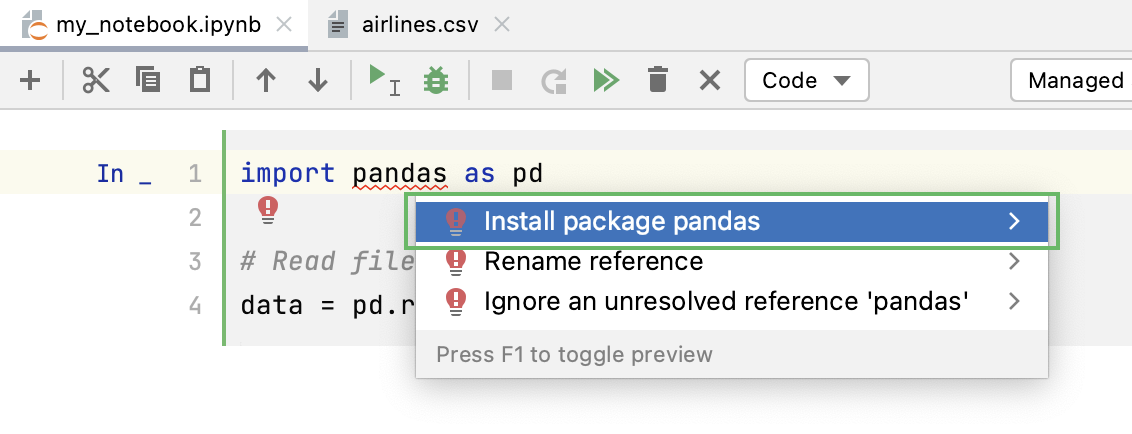
The required package will be installed and the red curvy line will no longer be displayed.
DataSpell allows viewing variables during notebooks execution. To do that, click Jupyter Variables in the lower-right part of the DataSpell window. Now there is a data variable that points to a pandas DataFrame structure:

To view the data as a table in a separate tab, click the View as DataFrame link.
You can also print out the data by typing the DataFrame name:
Press Ctrl+Enter to run the cell. The output is displayed under the code cell:
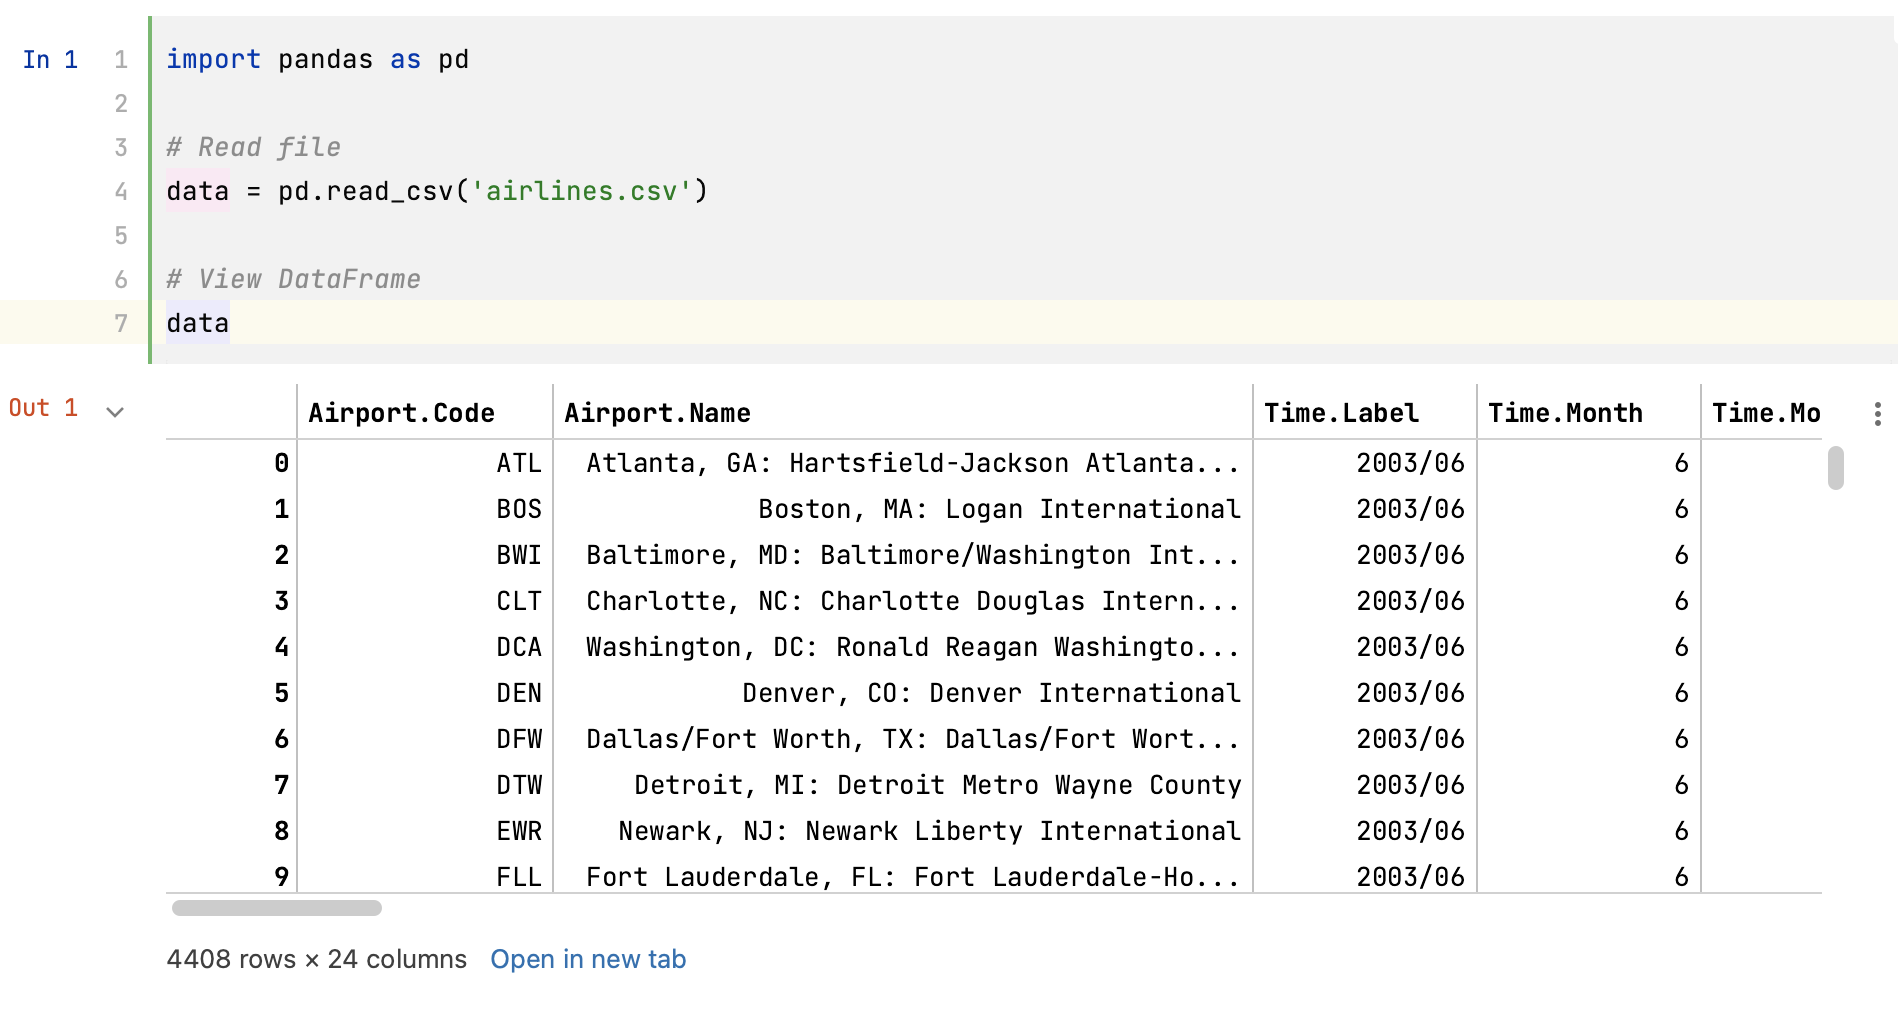
You can scroll the output cell. DataSpell will load and display the data dynamically.
Summary
Congratulations on completing this basic data science tutorial! Here's what you have done:
Created a directory in the workspace
Downloaded a dataset and prepared it for research
Created a notebook and ran it for the first time
As a next step, learn to visualize data with matplotlib.