Use dotPeek as a symbol server
dotPeek can function as a symbol server, that is, it can supply a debugger with the information required to debug compiled assemblies.
In contrast to traditional symbol servers, for example Microsoft Symbol Server, dotPeek does not store any symbol files, it generates PDB and source files for the requested assemblies and returns them back to the debugger.
Run dotPeek Symbol Server
Click Start/Stop Symbol Server
 on the toolbar.
Choose in the main menu.
At the first start of dotPeek symbol server, you are asked to choose the assemblies you want to generate symbol files for. See Configuring dotPeek Symbol Server below to learn about configuration options.
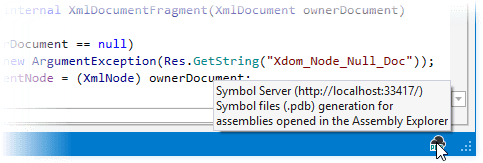
As soon as dotPeek symbol server is started, the corresponding icon appears in the status bar. You can hover the mouse pointer over it to check its address and the current configuration:

To make use of dotPeek symbol server, you can specify its address in your debugger settings. In Microsoft Visual Studio, the configuration is as follows:
Set up Visual Studio for working with dotPeek Symbol Server
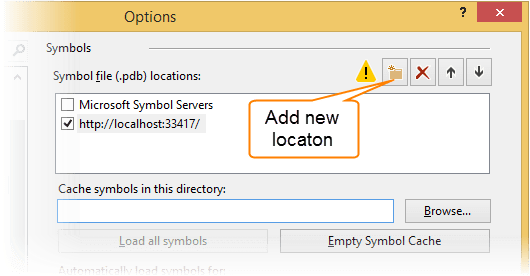
In the Visual Studio menu, select .
Click Add new location and specify the following address for it: http://localhost:33417/. (The port number is configurable on the page of dotPeek options.)

In the Visual Studio options, go to the Debugging | General page and clear the Enable Just My Code checkbox.
Configure dotPeek Symbol Server
dotPeek symbol server allows you to choose the exact assemblies for which symbol files should be generated. The correct configuration prevents you from undesired stepping into system assemblies or other assemblies that you are not interested in.
Select from the main menu , then choose on the left.
Using the radio buttons, choose one of the options under the Generate symbol files (.pdb) for. The meanings of the first four options are obvious. The last one allows for the most flexibility — after selecting this option, you can select only those assemblies which you need for debugging, and open them in the Assembly Explorer.
Optionally, you can change the port number that will be used for dotPeek symbol server.
Click OK.
Possible problems and solutions
If something goes wrong with dotPeek symbol server, the first thing you can do is to open the Project/PDB Generation Status window ( in dotPeek's menu). Here you can see all symbol server tasks as well as the results of the Generate PDB and the Generate Project commands. If some PDB was requested from dotPeek symbol server by a debugger but was not generated, you will see the corresponding entry with the error message in this window:
Most often, problems occur when the target assembly is not found. To fix that, you can open the assembly in the Assembly Explorer. If you don't know the location of the assembly, you can learn it when Visual Studio is in the debug mode — open the Modules window () and check the Path column.
If you are running dotPeek on 64-bit Windows, check that you are running the 64-bit version of dotPeek (there are two executables — dotPeek32.exe and dotPeek64.exe in the installation directory %LOCALAPPDATA%\JetBrains\Installations\dotPeek[N]) .
If the requested assembly does not appear in the Project/PDB Generation Status window, it means that the debugger has already found the corresponding symbol file and did not request it from dotPeek. If the symbol file is correct and the source code is available, then everything is fine, the assembly can be debugged without dotPeek. If not, try the following:
Delete or rename the PDB file that makes problems. You can always find the actual PDB file location, if any, for each assembly when Visual Studio is in the debug mode - open the Modules window () and check the Symbol File column.
If the PDB file is received from another symbol server, you can either disable this server or move the dotPeek symbol server up in the list of symbol servers ( in the Visual Studio options).
When debugging optimized assemblies, some debugger functions are just not available, for example you would not see values of local variables, even if symbol files are correct. So you might want to disable the optimization.
Check if the assembly is optimized when Visual Studio is in the debug mode — open the Modules window () and check the Optimized column.
Select Suppress JIT optimization on module load checkbox in Visual Studio options ().
To disable the use of all NGEN (pre-JIT) images (*.ni.dll), you can set the environmental variable
COMPLUS_ZapDisable=1. Check out these articles for examples and more information: