Call Tree (Icicle Chart)
The Icicle chart is a graphical representation of the stack trace responsible for creating a selected object set.
As well as in Call Tree, calls are shown starting from the first call in the stack descending to the one that directly created the object set. Each call is shown as a horizontal bar which length depends on the size of objects allocated in the call's subtree. The more memory was allocated in the underlying subtree, the longer the bar. It's obvious that over the subtree, function calls (bars) can only reduce in size giving the subtree a look of an icicle.
Use the Icicle chart to get an overview of the stack trace in just one glance. Without digging into the stack trace, you can quickly determine which function in the subtree allocates most of memory.
Example
Consider the example below for better understanding of the Icicle chart.

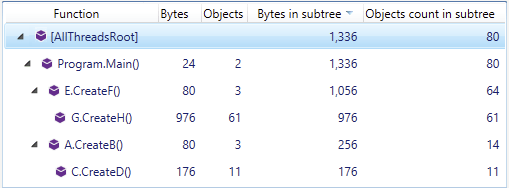
As you can see, to analyze the Call Tree, you have to expand all subtrees in the stack and interpret the numbers in the Bytes and Bytes in subtree columns. In contrast, just a glance at the Icicle chart allows you to determine main memory generator in the stack - the "green icicle". A click on a function you're interested in will show you the corresponding stack trace (on the right).
The Allocated in function value shows how much memory was allocated directly in the selected function.
The Allocated in subtree value shows the amount of memory allocated in the selected function and all underlying functions in the subtree.

How the icicle chart is painted
Here are the rules of how dotMemory paints bars (functions) on the Icicle chart:
Allocated memory
The more memory is allocated by a function, the larger the color value of the corresponding icicle bar. Thus, functions that do not create objects by themselves look pale. Vice versa, functions that allocate memory look darker.
Branching
Each new call subtree (when a function calls two more other functions) in the stack is painted with a new color.
System namespace
To help you distinguish system calls from other ones, all functions from theSystemnamespace are painted in less saturated color. Consider the example below: TheThemeCatalogRegistrarBaseclass doesn't belong to theSystemnamespace.
Functions with almost no allocations
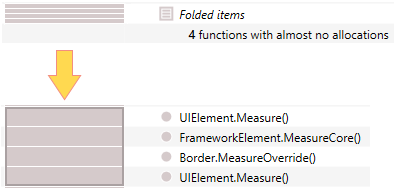
For the sake of simplicity, when a number (more than five) of subsequent calls do not allocate memory*, dotMemory groups them into one bar. Typically, these are system calls that are of no interest for the analysis. In the stack trace, such groups of calls are shown as Folded items and the corresponding bars are painted with the horizontal line pattern.
To expand the bars, use the middle-click.
Zooming in and out
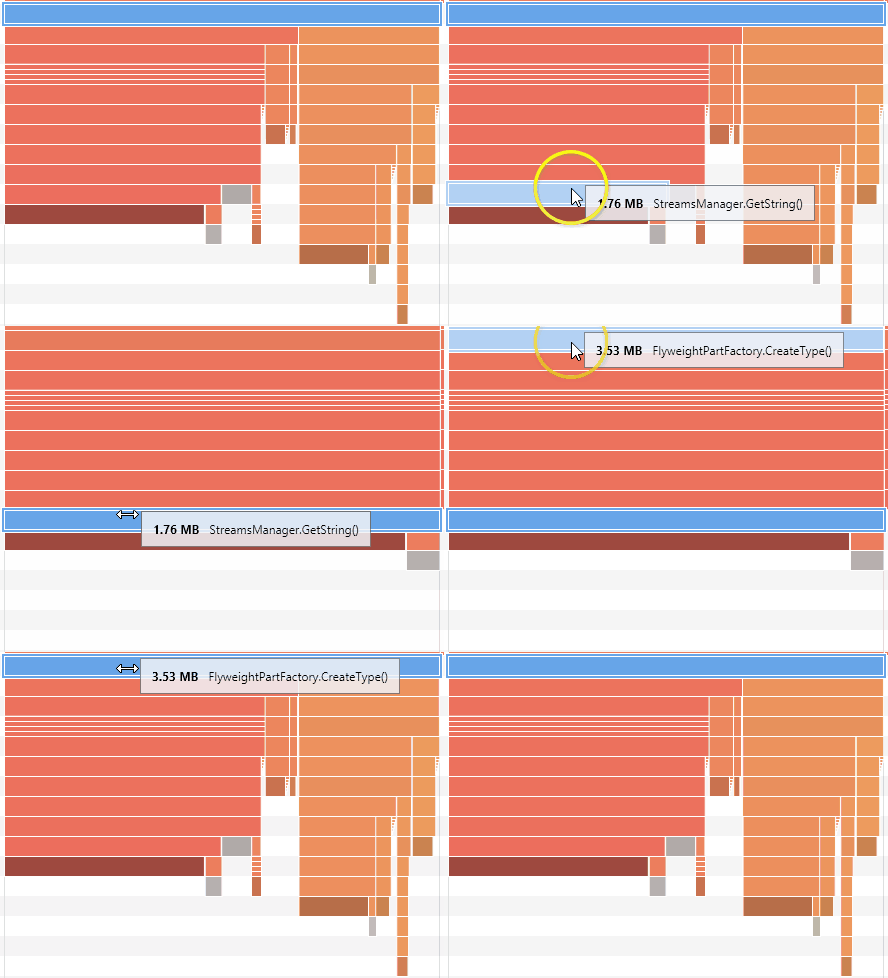
If you want to take a more detailed look at a certain call subtree, you can change the scale of the Icicle chart.
To zoom in on a call
Apply Shift + click to the corresponding bar.
The bar will take the entire width of the chart.
To zoom back out
Double-click or use Shift + click on a call that is located higher in the stack (as it is represented with a longer bar).

Selecting objects for further analysis
As well as in the Call Tree view, you can select the following subjects for further analysis:
To select objects allocated by a particular function instance (exact call)
Do one of the following:
Double-click a corresponding bar.
Right-click the bar and choose Open objects allocated by this instance of the function.
After this, the Created in instance of function [function_name] subject will be added to the Analysis Path and the list of desired objects will be displayed in the Group by Types view.
To select objects allocated in a function subtree (function instance and all its underlying calls)
Right-click the corresponding bar and choose Open objects allocated by all functions in this subtree.
After this, the Created in subtree of function [function_name] subject will be added to the Analysis Path and the list of desired objects will be displayed in the Group by Types view.
To select objects allocated in all instances of a function
Right-click the corresponding bar and choose Open objects allocated by all instances of the function.
After this, the Created in all instances of function [Function_name] subject will be added to the Analysis Path and the list of desired objects will be displayed in the Group by Types view.
To select the objects that are exclusively retained by the analyzed objects set
Click the
 Open objects retained by this set button.
After this, the Exclusively retained objects subject will be added to the Analysis Path and the list of desired objects will be displayed in the Group by Types view.