First Look at the User Interface
We want you to think of your work in dotMemory as of some sort of crime investigation (memory analysis in terms of dotMemory). The main idea here is to collect data (one or more memory snapshots) and choose a number of suspects (analysis subjects that potentially cause the issue). So, you start with some list of suspects and continuously narrow this list. One suspect may lead you to another, and so on, until you determine the guilty one.

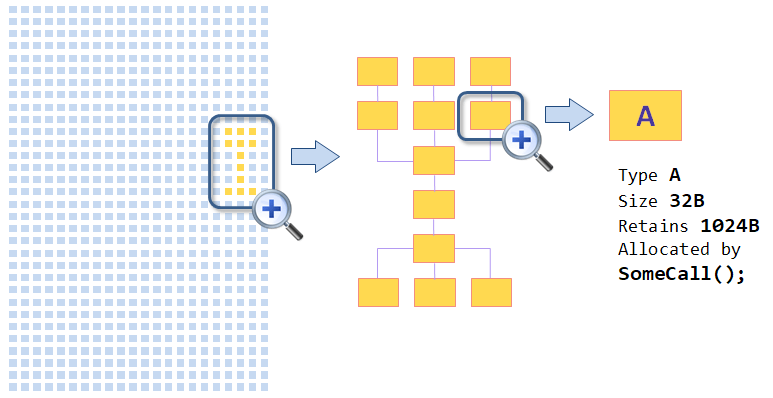
This analysis concept (when you narrow your research scope from bigger to smaller entities) is what makes dotMemory so different compared to other profilers. Unlike competitors, dotMemory allows you to operate not only with separate objects but with so-called object sets. Object set is a number of objects selected by a specific condition. To ease the understanding, think of an object set as of the result of some query (very similar to an SQL query). For example, you can tell dotMemory something like "Select all objects created by the call SomeCall(); and promoted to Gen 2", or "Select all objects retained in memory by the instance A", and so on.
The user interface

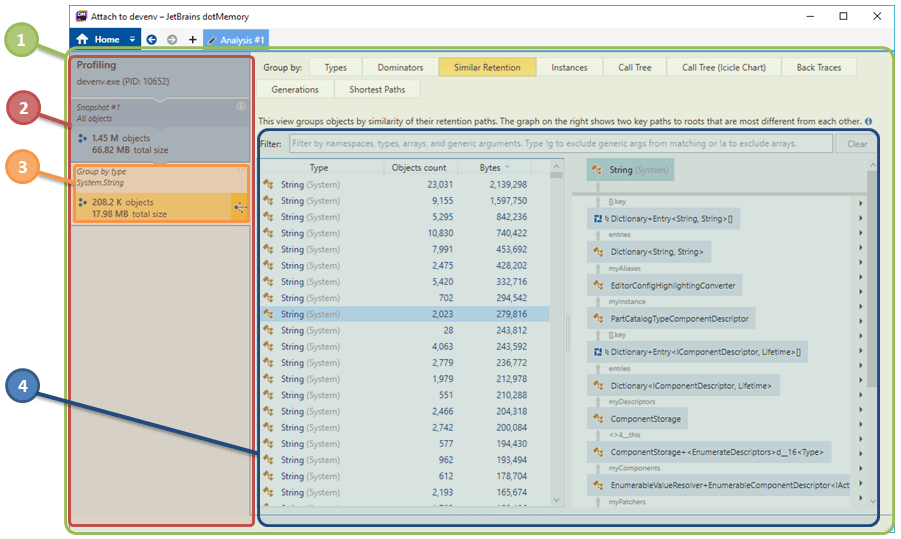
The dotMemory user interface fully reflects the idea of the step-by-step investigation.
![]() Analysis
Analysis
After you collect one or more memory snapshots, you can start the Analysis. New Analysis is opened in a new tab in the main dotMemory window. Note that you can perform a number of independent analyses of the same data (they will be opened in other tabs after you click the ![]() button).
button).
![]() Analysis Path
Analysis Path
On the left side of the analysis page, you can see the so-called Analysis Path list. Literally, this is a list that shows the path of your investigation. Any subject (3) you select for analysis is brought to this list. If you understand that your investigation is stalled, simply return back to a step in the Analysis Path where you picked a wrong decision (subject) and pick another one.
![]() Analysis Subject
Analysis Subject
The subject is what you analyze. To make things easier, let's return to the concept of narrowing the list of suspects: You start with investigating a big subject like an entire snapshot or memory traffic and then narrow your research scope to smaller entities. On this level you operate with object sets - a number of objects selected by a specific condition. Finally, your investigation may lead you even to a lower level - analyzing separate object instances.
![]() Views
Views
Each subject can be inspected from different perspectives - views. For example, the Dominators view will show you what objects retain the subject in memory (prevent it from being collected); the Call Tree view will help you to determine what call created the subject, and so on. As we mentioned earlier, one suspect may lead you to another one. For example, for each item in the Dominators view, you can select either the object that retains the current item or the object subset retained by it.
Learn more about how to perform analysis in the Analyzing Results chapter.