Get Started with dotMemory
Sample application | |
In this tutorial, we will learn how to run dotMemory and get memory snapshots. In addition, we will take a brief look at dotMemory's user interface and basic profiling concepts. Consider this tutorial as your starting point to dotMemory.
Basic terms
You might ask: "What are memory snapshots and why should I get them?" This is a good time to agree on some memory profiling terms you'll come across while using dotMemory.
From memory perspective, the work of your application consists of continuous allocation of memory for new objects and releasing the memory left from the objects that are no longer used by the app. Objects are allocated one after another in the so-called managed heap. Based on this, we have two basic operations a memory profiler must be able to do:
Get a memory snapshot. Snapshot is an instant image of the managed heap. Each snapshot contains the info about all the objects that your app has allocated in memory at the moment you click the Get Snapshot button.
Collect memory traffic information. Memory traffic shows you how much memory was allocated and released, e.g., between two memory snapshots. This info is also very valuable as it allows you to understand the dynamics of how your application performs.
The time interval during which you collect traffic and get snapshots (or, in other words, profile your application) is called profiling session.
Of course, there are some other terms that you'll get acquainted with while following the tutorial. But for now this is enough to understand what's going on in the next couple of steps. Let's get started!
Sample application
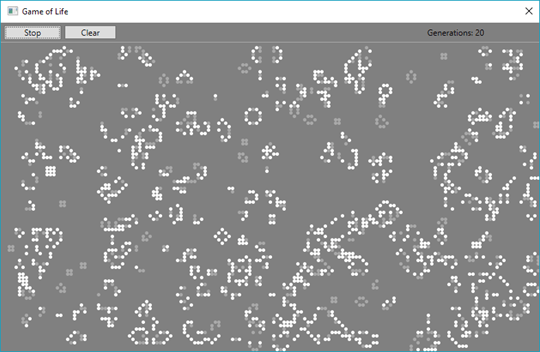
First of all, we need an application for profiling. Through the whole series of dotMemory tutorials, we will use the same C# application. It emulates the classic Conway's Game of Life that most of you probably know. If not, check Wikipedia. This won't take a lot of time but will make the understanding of tutorials much easier. So, before we start, download the application from github.
Step 1. Run dotMemory
Run dotMemory by using Windows Start menu.

This will open the main dotMemory window.
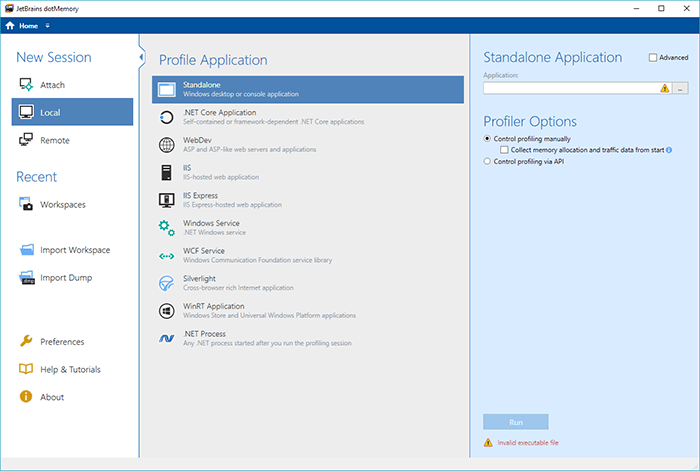
Now let's start a profiling session (a timeframe during which dotMemory will collect memory usage data).
Select Local on the left panel and in Profile Application, choose Standalone application.
Now we should configure profiling session options. In the right panel:
In Application, specify the path to our Game of Life executable. It is recommended that you profile application's Release builds*.
Select the Collect memory allocation and traffic data from start option. This will tell dotMemory to start collecting allocation call stack data right after the app is launched.
Here is what the window should look like after you specify all the options:
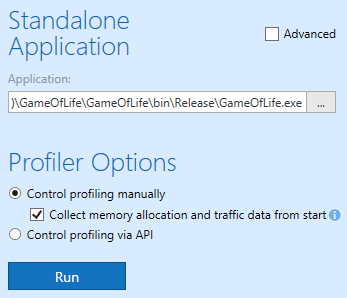
Click Run to start the profiling session. This will run our app and open a new Analysis tab in dotMemory.
Step 2. Get a snapshot
Once the app is running, we can get memory snapshots. The most important thing in this operation is choosing the right moment for it. As you remember, a snapshot is the instant image of the application's managed heap. Thus, the first thing you should do before taking a snapshot is bring your application to the state you're interested in. For example, if we want to take a look at the objects created right after Game of Life is launched, we must get a snapshot before taking any actions in the app. Conversely, if we need to know what objects are created dynamically, we must take a snapshot after we click Start in the application.
Let's assume we need to get info about objects allocated when Game of Life runs. Therefore, click the Start button in the application and let the game run for a while.
Click the Get Snapshot button in dotMemory.
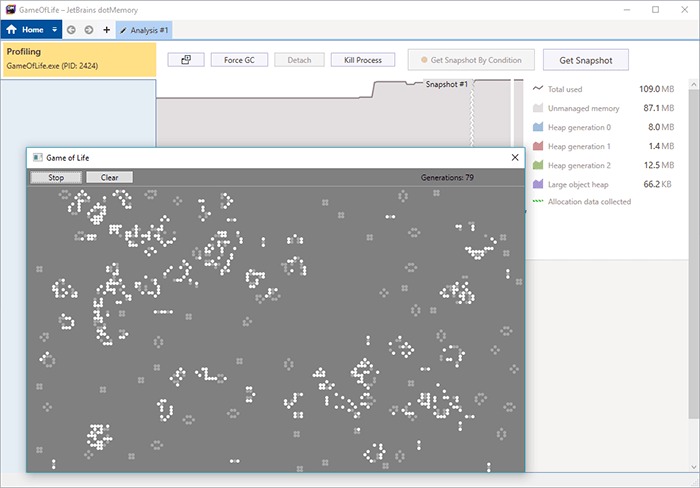
This will capture the data and add the snapshot to the snapshot area. Getting a snapshot doesn't interrupt the profiling process, thus allowing us to get another snapshot (not needed for now).
End the profiling session by closing the Game of Life window.
Look at dotMemory. The main page now contains the single taken snapshot with basic information.
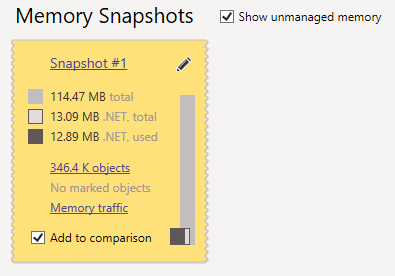
114.47 MB total means that the application consumes 114.47 MB of memory in total. This size is equal to Windows Task Manager's Commit size: the amount of memory requested by a process. The total value consists of:
Unmanaged memory: memory allocated outside of the managed heap and not managed by Garbage Collector. Generally, this is the memory required by .NET CLR, dynamic libraries, graphics buffer (especially large for WPF apps that intensively use graphics), and so on. This part of memory cannot be analyzed in the profiler.
.NET, total: total amount of memory in the managed heap including free memory (requested but not used by the application).
.NET, used: amount of memory in the managed heap that is used by the application. This is the only part of memory .NET allows you to work with. For this reason, it's also the only part which you're able to analyze in the profiler.
Let's take a look at the snapshot in more details. To do this, click the Snapshot #1 link.
Step 3. Get acquainted with Snapshot Overview
The first thing you see after opening the snapshot is the Inspections view. This page shows you main snapshot hot spots.

What you see here:
Largest Size: the diagram shows types of objects that consume the major part of memory.
Largest Retained Size: the diagram shows you the key objects, the ones that hold in memory all other objects in the application (more info about them later in this tutorial).
String duplicates, Sparse arrays, Event handlers leak, and so on: to ease your life, dotMemory automatically checks the snapshot for most common types of memory issues. If you don't know where to start, the results of these automatic inspections is a good entry point.
Heap Fragmentation: the diagram shows the fragmentation of the managed heap segments: Generation 1, 2, and Large Object Heap.
Let's continue with examining the snapshot and view the objects it contains:
Click the Types button. This will group all objects in the snapshot by their type and show you the Types view.
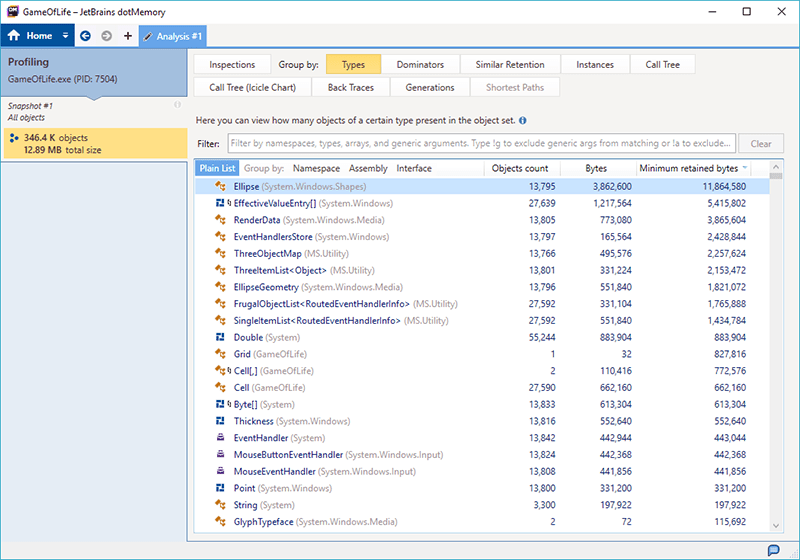
Now, it's the best time to acquaint with the dotMemory user interface and the entire memory analysis "stuff".
Step 4. Memory analysis primer
Before we go any further, let's take a little detour and talk about how objects are stored in memory. This is needed for better understanding of what dotMemory actually shows you.
Objects in memory
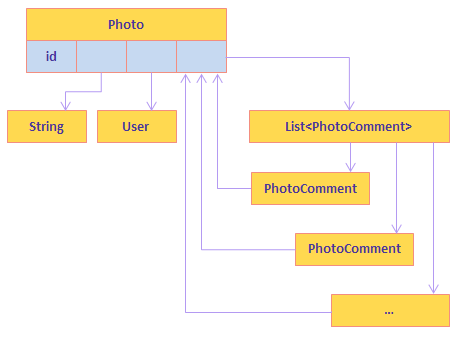
The major part of the memory consumed by your application is allocated for the application's objects. Objects store data and reference other objects. An object and its references make up an object graph. For example, an object of the Photo class will store the id field of the long value type by itself and reference other fields (objects of reference types).
App roots
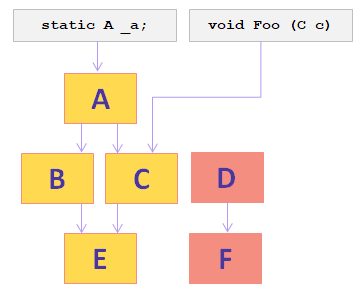
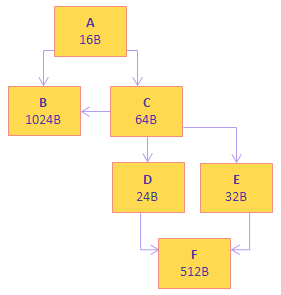
When your application needs memory, .NET's Garbage Collector (GC) determines and removes the objects that are no longer needed. To do this, GC passes down the graph of each object starting with roots*, that is static fields, local variables and external handles. If the object is unreachable from any root, it's considered as no longer needed and is removed from memory. In the example below, objects D and F will be removed from memory as they cannot be accessed from the application's roots.
Retention
Here we come to the crucial concept of retention.
A path from roots to an object may lead through a number of other objects. If all paths to the object B pass through the object A, then A is a dominator for B. In other words, B is retained in memory exclusively by A. If A is garbage-collected, B will also be garbage-collected. That is why the most important parameter of each object is the size of the objects it retains. In dotMemory, this parameter is called Retained bytes. For instance, object C in the example below retains 632 bytes. Object B is not exclusively retained by C; therefore, it is not included in the calculation.
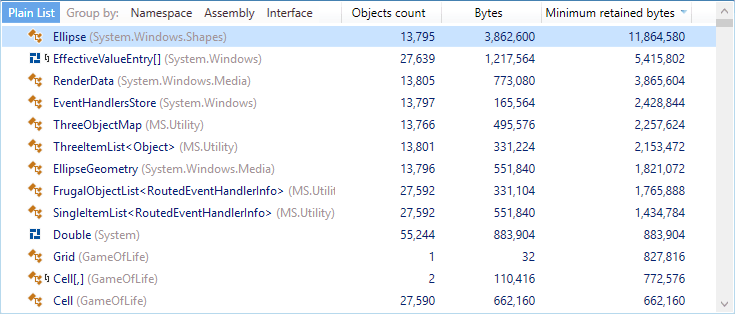
Let's return to dotMemory and take a look at the opened Types view. This view currently shows you all objects in the heap, sorted by the amount of memory they exclusively retain. As you can see, the major part is retained by the System.Windows.Shapes.Ellipse class (apparently, these are ellipse shapes we use to visualize Game of Life cells). Objects of that type retain 11,864,580 bytes of memory, while consuming 3,862,600 bytes by themselves.
Once you're familiar with the main profiling terms, let's look at how we can work with dotMemory.
Step 5. Get acquainted with the user interface
We want you to think of your work in dotMemory as of some sort of crime investigation (memory analysis in terms of dotMemory). The main idea here is to collect data (one or more memory snapshots) and choose a number of suspects (analysis subjects that are potentially causing the issue). So, you start with some list of suspects and gradually narrow this list down. One suspect may lead you to another and so on, until you determine the guilty one.
Look at the left part of the dotMemory window. It is Analysis Path where all your investigation steps are shown.
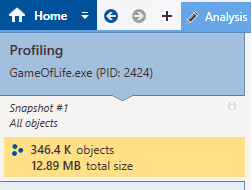
Each item in Analysis Path is the subject you analyze. As you can see, you started with Profiling GameOfLife.exe (step #1), then you opened Snapshot #1 (step #2) and asked dotMemory to show you all objects in the heap (object set All objects). As even a tiny app creates numerous objects, the attempt to analyze each object separately will not be very effective. That is why the main subject of your analysis in dotMemory is the so-called object set.
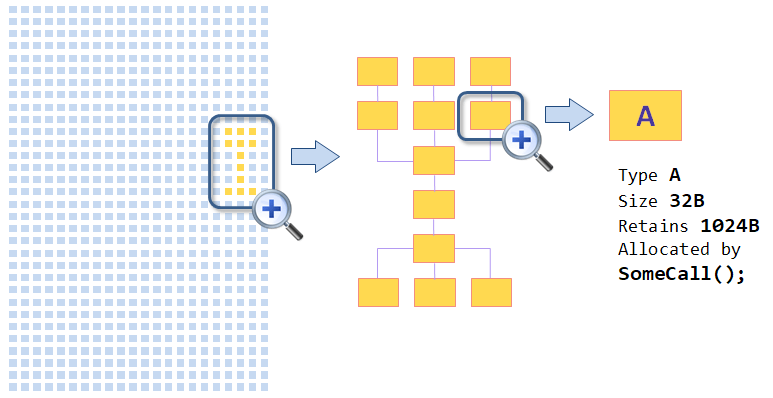
Object set is a number of objects selected by a specific condition. For ease of understanding, think of an object set as of a result of some query* (very similar to an SQL query). For example, you can tell dotMemory something like "Select all objects created by SomeCall() and promoted to Gen 2", or "Select all objects retained in memory by the instance A", and so on.
Each object set can be inspected from different perspectives called views. Look at the screen. The view you see is called Types, and it shows you a plain list of objects in the set grouped by their type. Other views can reveal other info about the selected set. For example, the Dominators view will show you who retains the selected objects in memory; Call Tree will show you what calls created the objects; and so on. You can easily change the view using the buttons at the top of the screen:

As mentioned above, each subject you analysis may lead you to another subject. For example, we see that the
System.Windows.Shapes.Ellipseclass retains most of the memory, and we want to know what method created all these ellipses. Let's find this out.Double-click System.Windows.Shapes.Ellipse or open the context menu (with the right click) for these objects and select Open this object set.
Select Back Traces view.
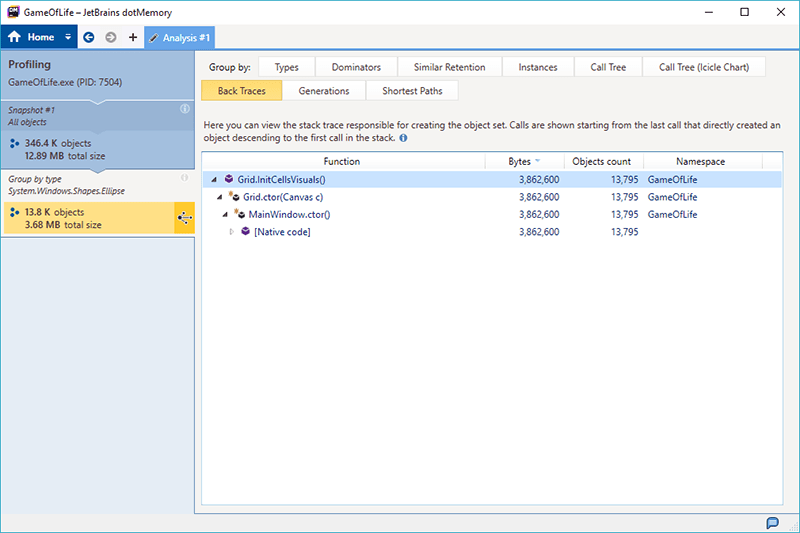
The view shows that our ellipses originate from the
Grid.InitCellsVisuals()method. Note that the Analysis Path now contains one more step: Group by type System.Windows.Shapes.Ellipse.Experiment with dotMemory a little bit. For example, determine what is retained by the objects of the System.Windows.Shapes.Ellipse class.