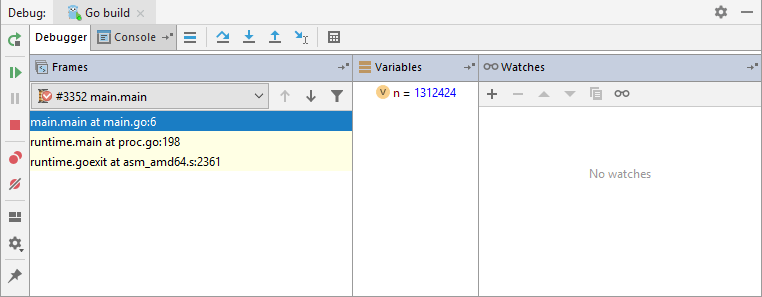
Debug tool window
This tool window becomes available when you start debugging.
It displays the output generated by the debugging session for your application. If you are debugging multiple run/debug configurations, the output for each configuration is displayed in a separate tab named after the corresponding configuration.
For each configuration, there are the following nested tabs:
Console: displays system information and error messages, and the console input and output of your application.
- Debugger: this tab is divided into the following areas:
Each area has a context menu that allows you to configure its behavior and navigate between tabs.
Each of the tabs and areas can be hidden/restored, or moved to a location of your choice.

Moving tabs and areas
If you are unhappy with the default layout of the Debug tool window, you can always move the tabs and areas. To do that, just drag a tab or an area to the desired location. The possible target gets highlighted.
Drop the tab or area in the highlighted location.
To restore the default layout of tabs and area, click in the Debug toolbar.
Context menu of a tab
Use the context menu of the Frames, Variables or Watches areas to configure the behavior of these areas or navigate between tabs.
| Item | Description |
|---|---|
| Hide | Click this button to hide the corresponding area |
| Close Others | Click this button to hide all tabs except for the Console and Debugger tabs. |
| Focus On Startup | If this option is selected, the selected area gets the focus when you start a debugging session. |
| Focus On Breakpoint | If this option is selected, the selected area gets the focus when a breakpoint is reached. |
| Select Next Tab / Select Previous Tab Ctrl+Alt+Right/ Ctrl+Alt+Left | Use these options to switch between the Console and the Debugger tabs. |
Debug toolbar
Regardless of the selected tab, you can always use the following toolbar controls in the left part of the window:
| Item | Tooltip and Shortcut | Description |
|---|---|---|
| Rerun Ctrl+F5 | Click this button to stop the current application and run it again. | |
| Resume Program F9 | When an application is paused, click this button to resume program execution. | |
| Pause Program Ctrl+Pause | Click this button to pause program execution. | |
| Stop Ctrl+F2 | Click this button to terminate the current process externally by means of the standard shutdown script. | |
| View Breakpoints Ctrl+Shift+F8 | Click this button to open the Breakpoints dialog where you can configure breakpoints behavior. | |
| Mute Breakpoints | Use this button to toggle breakpoints status. When the You can temporarily mute all the breakpoints in a project to execute the program without stopping at breakpoints. | |
| Settings | Click this button to open the menu with the following options:
| |
| Pin Tab | Click this button to pin or unpin the current tab. You may need to pin a tab to prevent it from closing automatically when the maximum number of tabs is reached in this window. |
Stepping toolbar
| Item | Tooltip and Shortcut | Description |
|---|---|---|
| Show Execution Point Alt+F10 | Click this button to highlight the current execution point in the editor and show the corresponding stack frame in the Frames pane. | |
| Step Over F8 | Click this button to execute the program until the next line in the current method or file, skipping the methods referenced at the current execution point (if any). If the current line is the last one in the method, execution steps to the line executed right after this method. | |
| Step Into F7 | Click this button to have the debugger step into the method called at the current execution point. | |
| Step Out Shift+F8 | Click this button to have the debugger step out of the current method, to the line executed right after it. | |
| Run to Cursor Alt+F9 | Click this button to resume program execution and pause until the execution point reaches the line at the current cursor location in the editor. No breakpoint is required. Actually, there is a temporary breakpoint set for the current line at the caret, which is removed once program execution is paused. Thus, if the caret is positioned at the line which has already been executed, the program will be just resumed for further execution, because there is no way to roll back to previous breakpoints. This action is especially useful when you have stepped deep into the methods sequence and need to step out of several methods at once. If there are breakpoints set for the lines that should be executed before bringing you to the specified line, the debugger will pause at the first encountered breakpoint. | |
| Evaluate Expression Alt+F8 | Click this button to. evaluate expressions. |