Profiling for tests
Profiling is an analysis of your program performance. During profiling, you see the CPU and memory usage, the frequency and duration of function and method calls. This information might be helpful if you want to optimize your program performance.
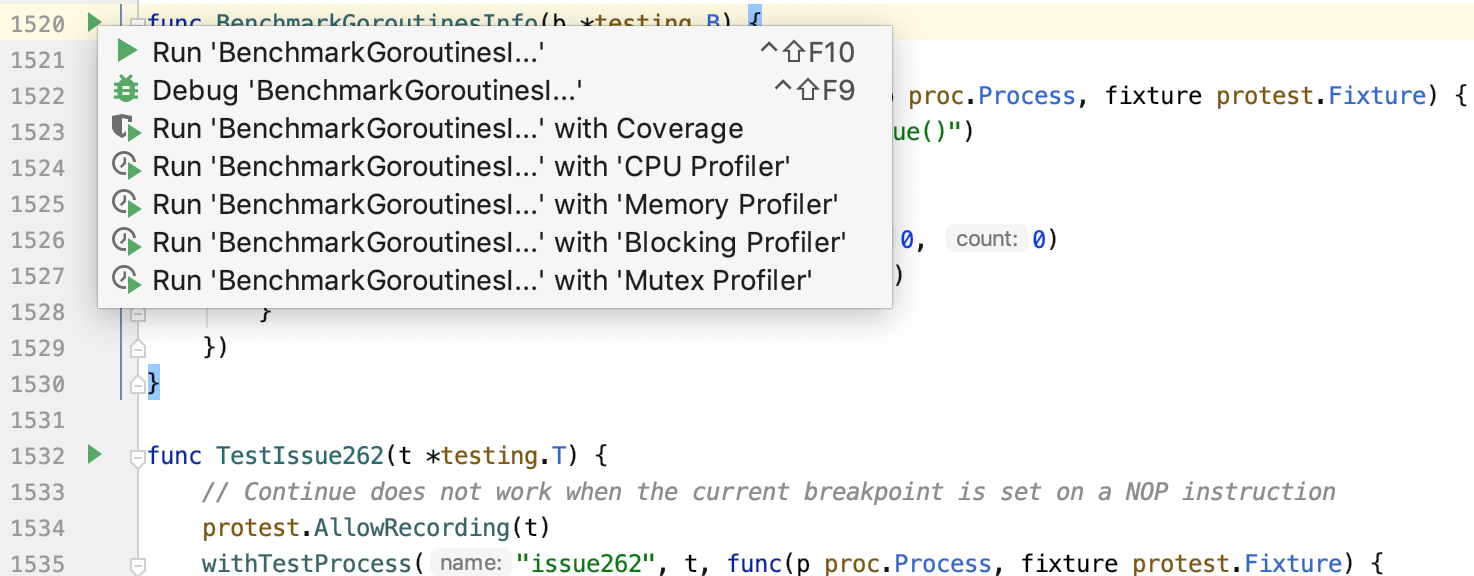
GoLand collects and visualizes CPU profiles, traces, and heap profiles for your Go tests and benchmarks. To collect all the necessary data, GoLand uses the pprof package. GoLand include four profilers that you can run from the user interface: CPU, memory, blocking (contention), and mutex.
Run profiling
The procedure of running a profiler is common for all profilers.
Open the _test.go file.
Near the function or method that you want to profile, click the Run Application icon
in the gutter area and select Run <configuration_name> with '<profiler_name> Profiler'.

Import profiler results
You can run your profiler code manually, import the results, and display them in GoLand.
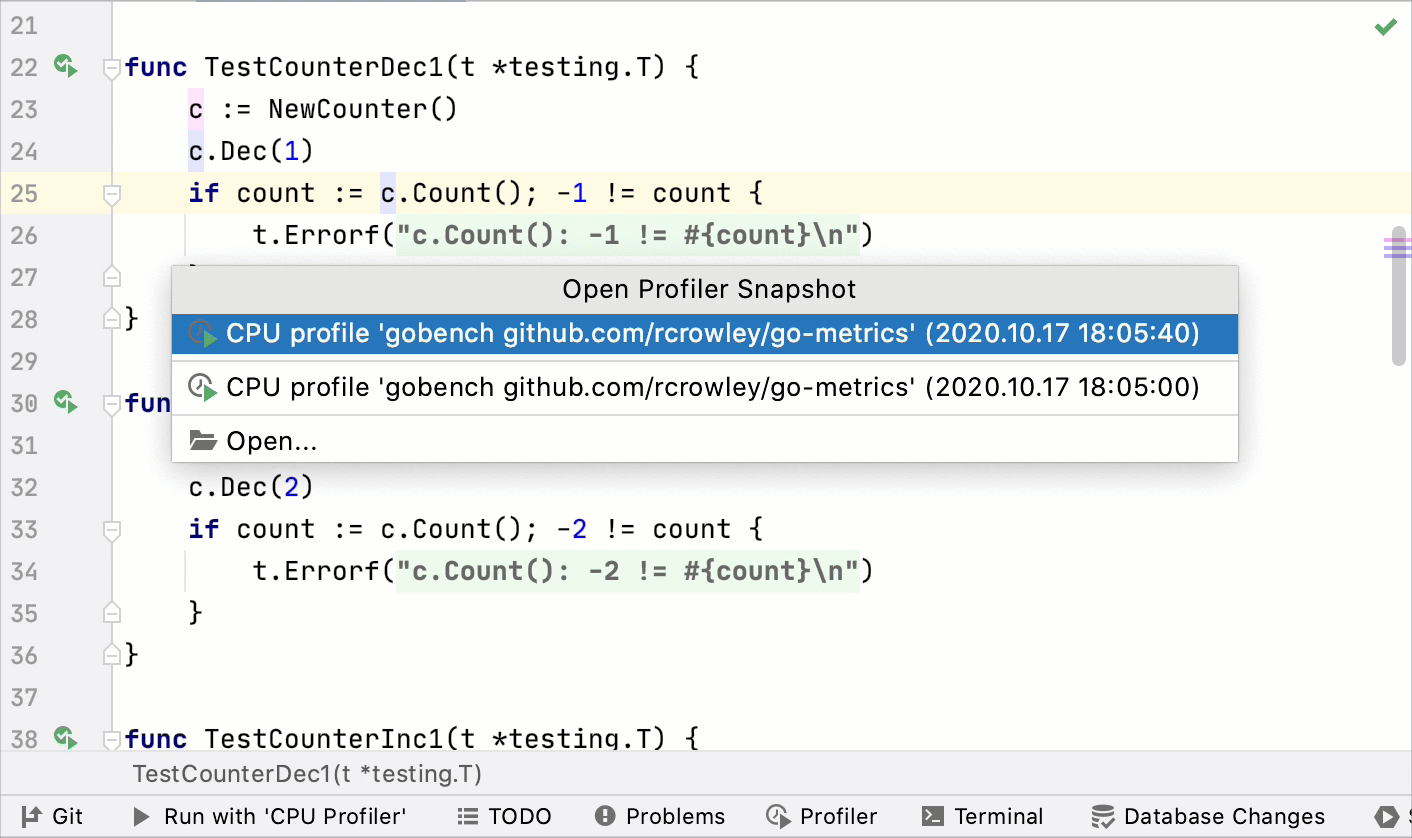
To import profiling results, quickly press Shift two times, type Open Profiler Snapshot, and press Enter. Select the result from the list or select Open Profiler Snapshot to upload the result from your hard drive.
