Using interactive Debugger Console
Required plugins:
JavaScript and TypeScript, JavaScript Debugger - The plugins are bundled with GoLand and enabled by default.
Node.js - Install the plugin on the Settings/Preferences | Plugins page, tab Marketplace.
The Process Console tab shows the output of the node process itself, that is, everything that is written to process.stdout and process.stderr directly or is logged using console.*.

In the Debugger Console, you can run JavaScript code snippets and view the console.* messages.

Run JavaScript in the Debugger Console
Start typing a statement at
>in the input field. As you type, GoLand suggests variants for completion.tip
When typing a multi-line code fragment, press Shift+Enter to start a new line and Ctrl+Enter to split a line.
Select the relevant statement and press Enter. GoLand shows its value in the debugger console.
 Gif
GifGoLand shows previews for objects so you do not need to expand them. If you still expand an object, you get an overview of just its own properties, the
__proto__contents are hidden by default.
Navigate to source code
At each line with output of
console.*, GoLand shows the name of the file and the line where it was called. Click this link to jump to the call in the source code. Gif
GifThe Debugger Console also shows stack traces. Click the link next to a reported problem to jump to the line of code where this problem occurred.
 Gif
Gif
Filter out messages
To hide log messages of specific types, click
 and select the severities to filter out.
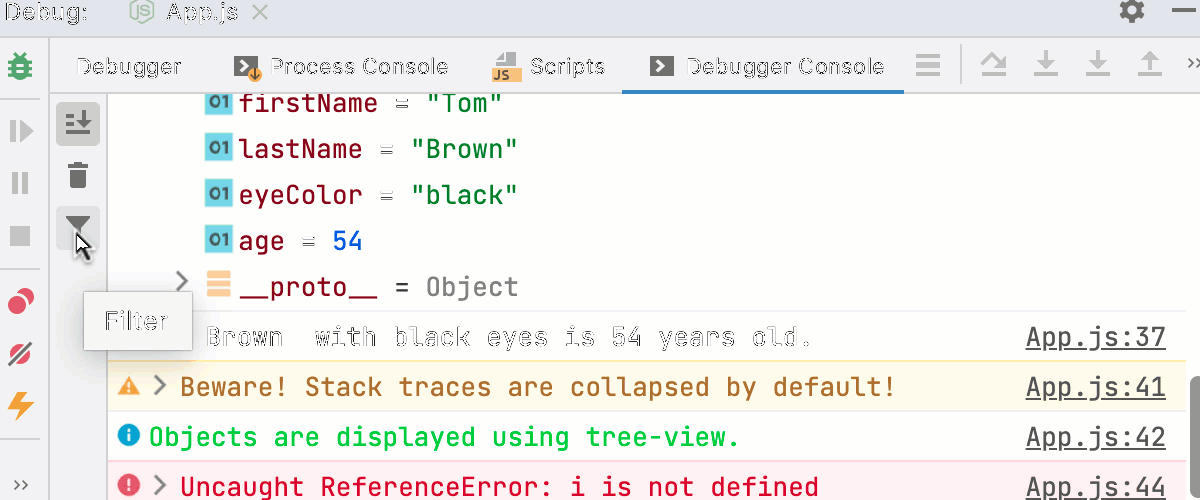 Gif
Gif
Group messages
The log messages grouped using
console.group()andconsole.groupEnd()are displayed as a tree. To show the output collapsed by default, useconsole.groupCollapsed().
Apply CSS styles
Use CSS and the
%cmarker to apply styles to log messages.
See Styling console output with CSS for details.
Thanks for your feedback!