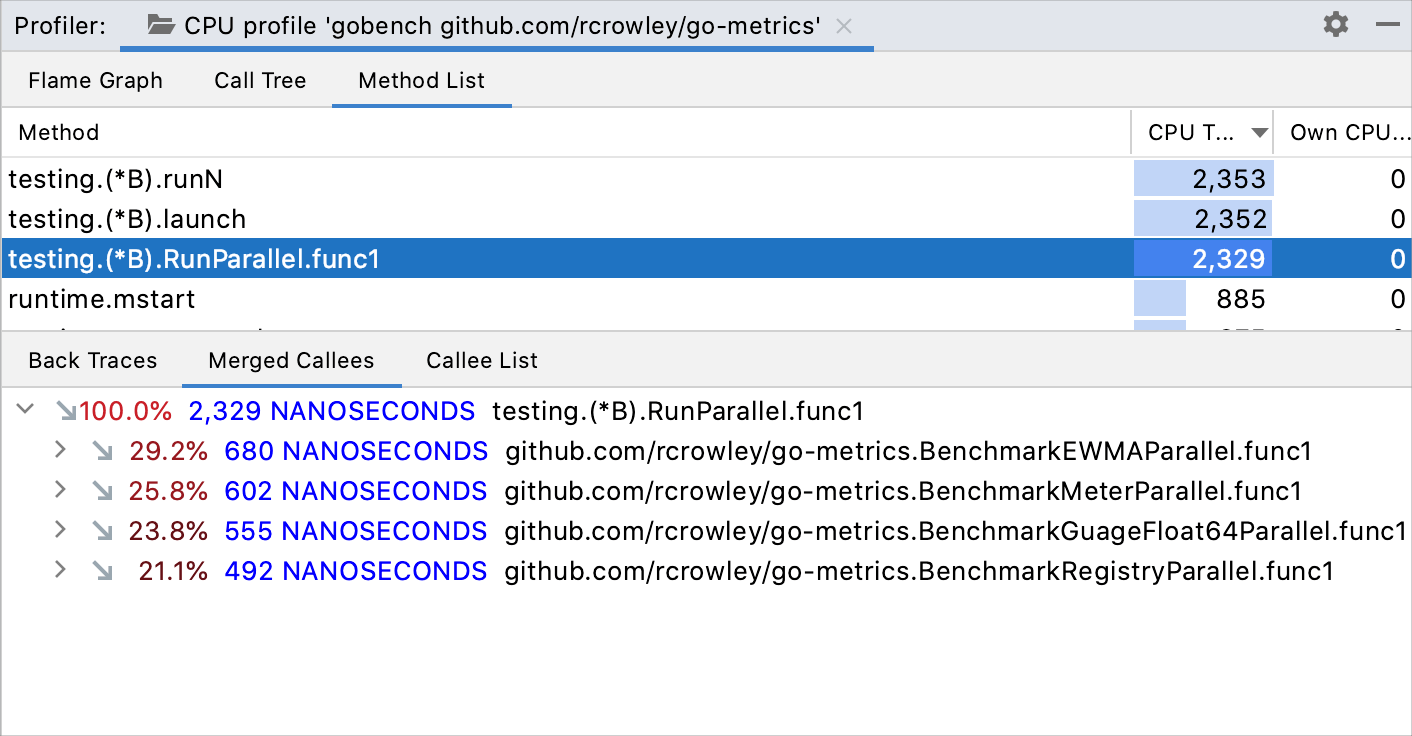
Read the profiler snapshot
In the Profiler tool window, the collected data is presented on several tabs: Flame Graph, Call Tree, and Method List.
Navigate the snapshot
You can jump between the tabs while staying focused on a specific method. Right-click the necessary method and select another view in which you want to open it.
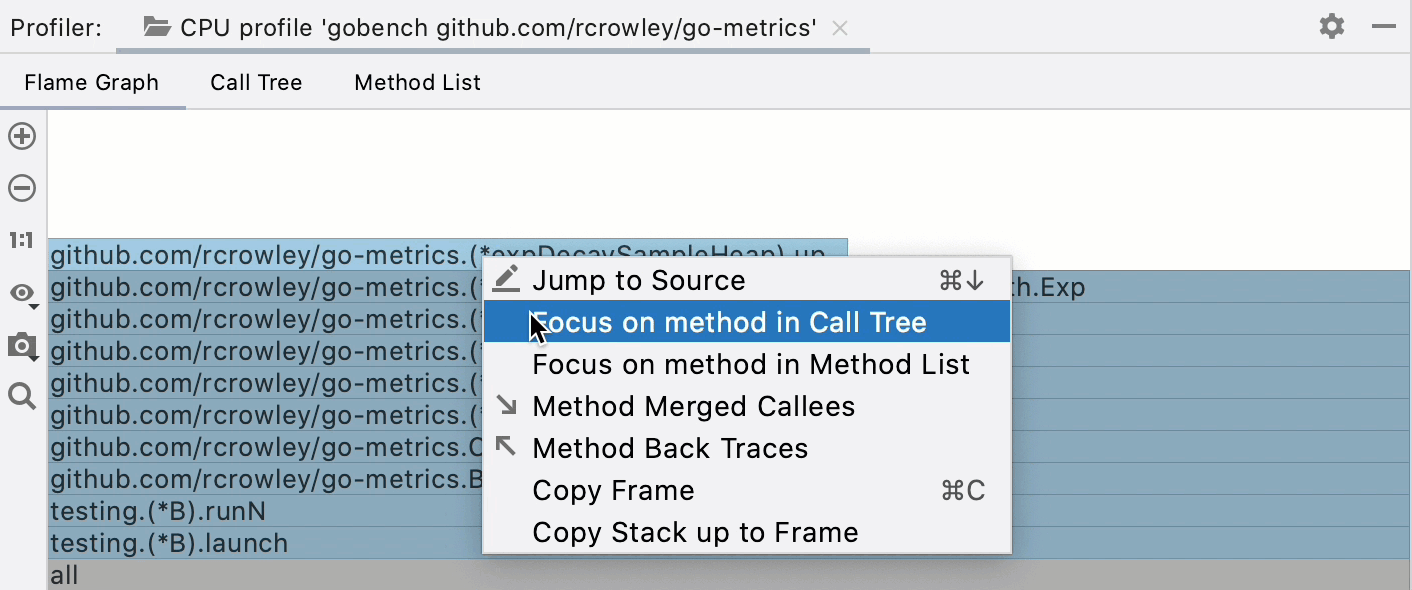
For a method on any tab, you can open the Merged Callees and Back Traces trees. Right-click the method and select Method Merged Callees or Method Back Traces respectively.
Flame Graph
The flame graph visualizes the application call tree with the rectangles that stand for frames of the call stack, ordered by width. Frames that consume more resources are wider than the others and are placed on the left.
Frame type | Light theme | Dark theme |
|---|---|---|
Project code | Yellow | Yellow |
Library code | Purple | Grey |
Native code | Blue | Blue |
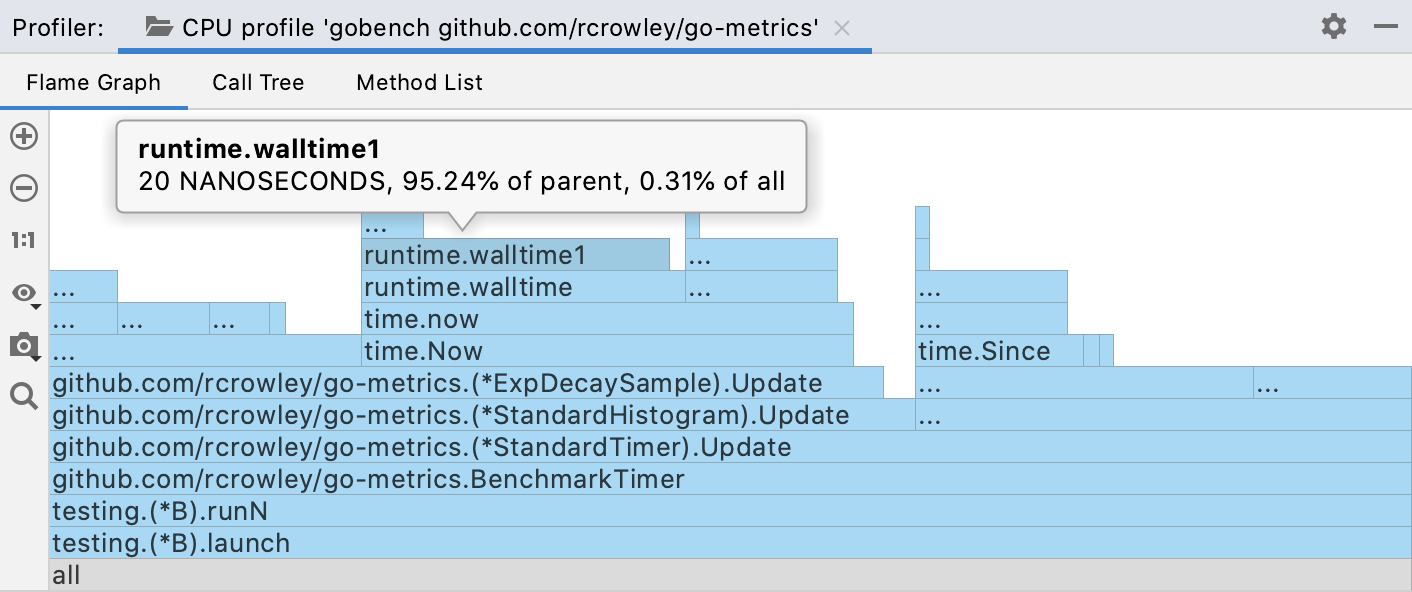
Get call details
Hover over a block to see the tooltip with frame details. The tooltip shows the share of time in the entire snapshot and in the frame's direct parent.
Zoom the graph
Use the
and
buttons on the flame graph's toolbar or the scroll wheel to zoom the graph.
To focus on a specific method, double-click the corresponding block on the graph.
To restore the original size of the graph, click 1:1 on the toolbar.
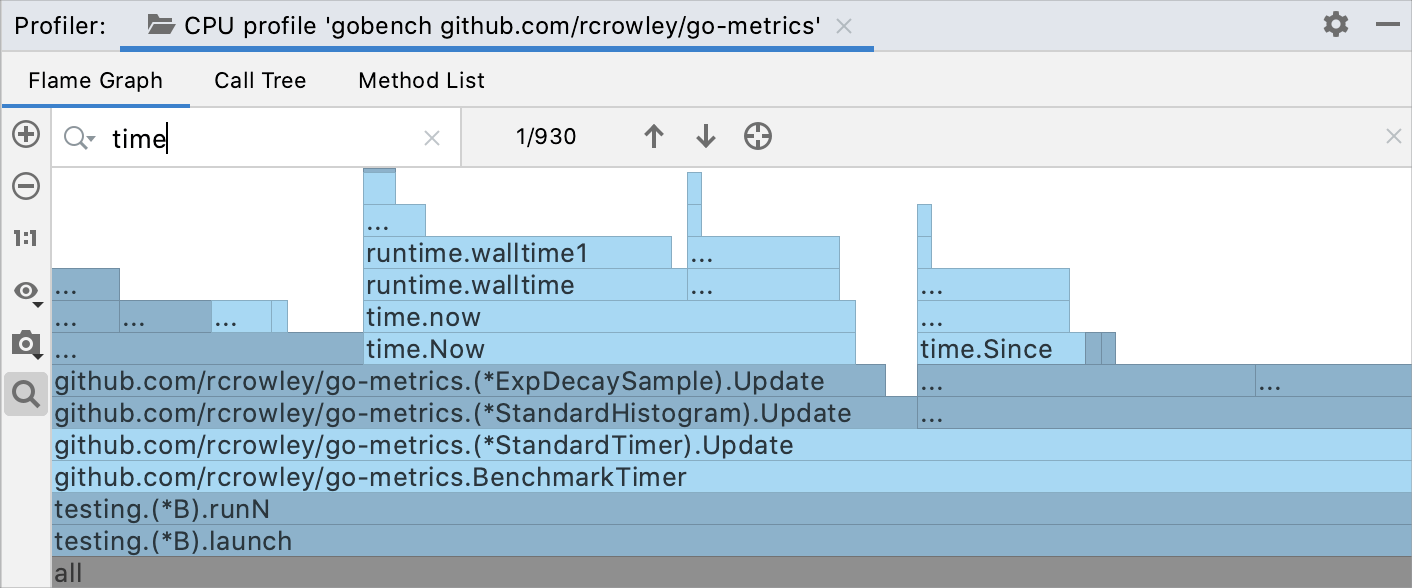
Search the graph
If you want to locate a specific method on the graph, start typing its name or click
and type the name in the search bar.
The graph highlights all blocks with method names matching your search request.
Use
and
for fast navigation between search results. Using the buttons on the toolbar, you can also search either the whole graph or a specific subtree and navigate to the results as soon as something was found.
Capture the graph
You can capture and export the graph separately from other data in the snapshot.
Click
and select Copy to Clipboard or click Save to export the graph as an image in the .png format.
You can visualize the difference between two snapshots on the flame graph.
Compare with a baseline
Open two snapshots. To open snapshots, you can run the profiler twice or go to and select snapshots here.
Click the Compare With Baseline button and select the snapshot that you want to compare against.
A separate diff tab will open with the results of the comparison, combining two flame graphs and showing the differences as red and green.
If you see that some part of the frame is green, it means that the corresponding method became faster during this profiler run. The red color means that the corresponding method became slower.

Call Tree
The Call Tree tab organizes the sampled data in a tree-like structure.
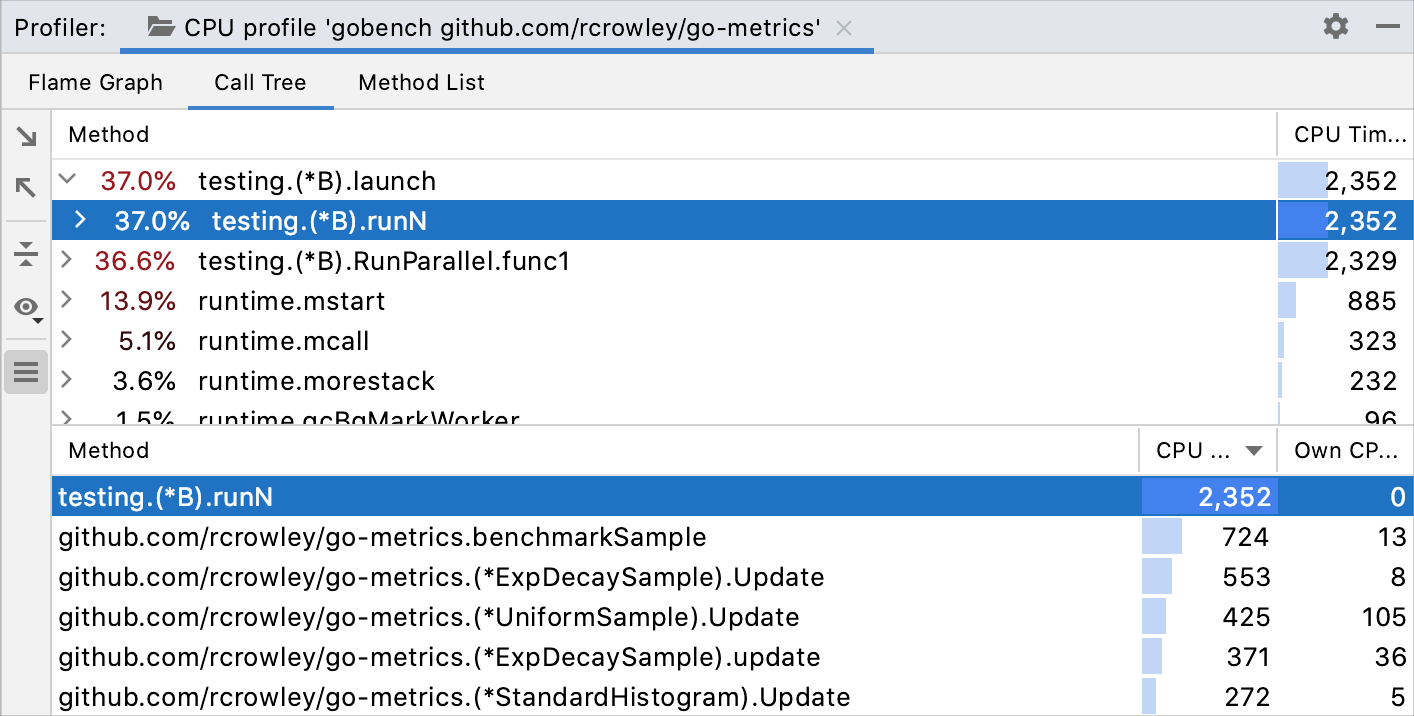
For each method, the tab shows the following information:
Share in the total execution time or parent's execution time
The aggregated execution time
By default, the percentage is relative to the total execution time. You can choose to view the numbers relative to the parent frame.
Switch the percentage between total and parent
Click
and select Show Percent of Total Time or Show Percent of Parent.
Collapse recursive calls
A stack that involves recursion may be very difficult to analyze. In a regular Call Tree view, recursive calls are displayed as they are called – one after another, which may lead to almost infinite stack scrolling.
GoLand detects recursion when the same method is called higher up in the call stack. In this case, the subtree is taken out of the call tree and then attached back to the first invocation of that method. This way you can bypass recursion and focus on methods that consume most of the resources and calls that they make.
Collapsing recursive calls allows you to see the total amount of time spent in these calls as if there was no recursion.

Folded recursive calls are marked with the icon on the Call Tree tab. Click it to open the recursive call tree in a separate tab. You can preview the number of merged calls in the tooltip that appears on hovering over the recursion icon.

What-if: focus on specific methods
GoLand allows you to examine specific nodes and subtrees in the Call Tree: you can exclude particular methods or the other way round, focus only on the nodes in which you are interested at the moment.
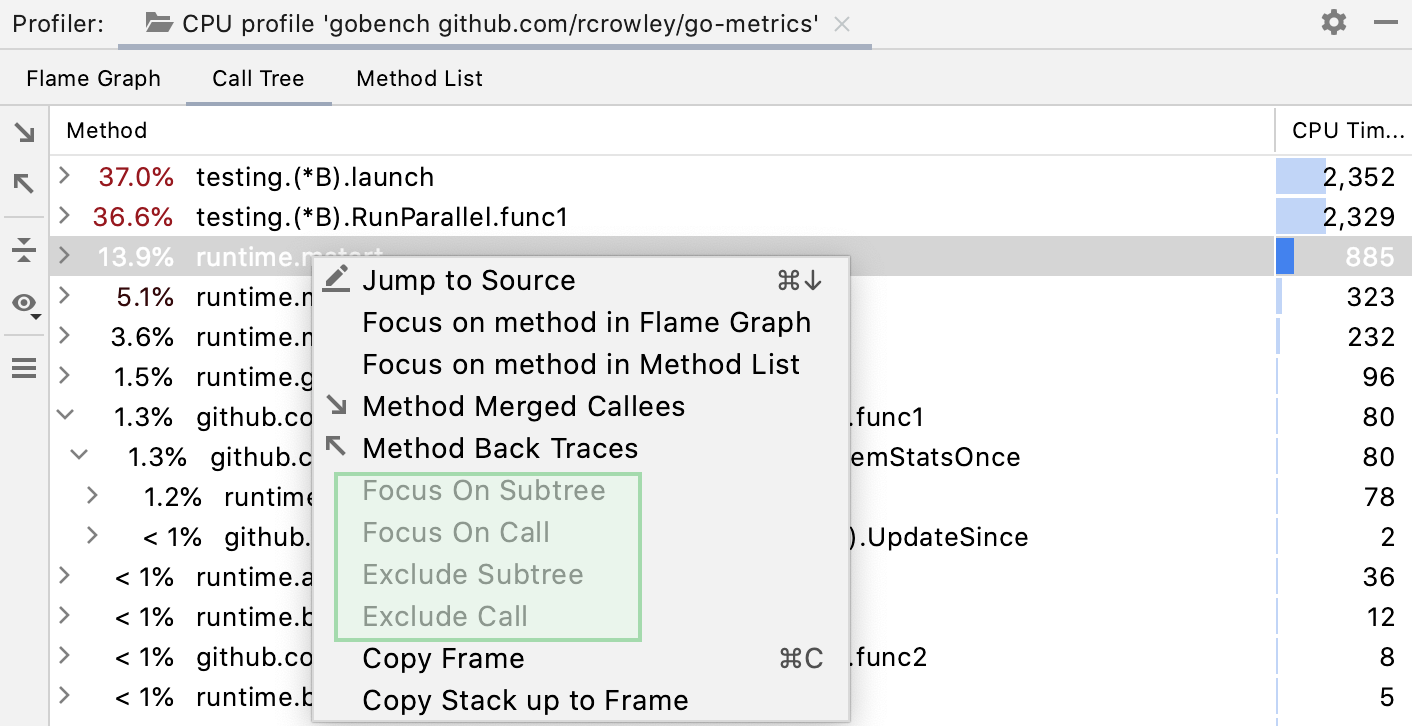
Right-click the necessary node on the Call Tree tab and select one of the following options to open the results in a dedicated tab:
Focus On Subtree: show only the selected method call. Parent method sample counter shows only the time spent in the selected subtree.
Focus On Call: show the selected method and the methods that call it. When this option is enabled, every frame shows only the time spent in the selected method.
Exclude Subtree: ignore the selected method call.
Exclude Call: ignore all calls to the selected method.
Method List
The Method List collects all methods in the profile data and sorts them by cumulative sample time. Every item in this list has several views:
Back Traces shows the hierarchy of callers. Use this view to trace which methods call the selected method.
Merged Callees is the call tree summarizing the methods down the call hierarchy.
Callee List is the method list summarizing the methods down the call hierarchy.
