Problems tool window
The Problems tool window displays problems that GoLand detects in your project on several tabs.
To jump to the corresponding line in the editor, you can select any problem in the window and press F4 or double-click it.
To cycle through the tool window tabs, press Alt+Right and Alt+Left.
To copy multiple problem descriptions at once, select them in the tool window and press Ctrl+C.
When the design-time code inspection is enabled, this tab lists all code issues found in the current file. The list is updated as you switch between files in the editor.

Toolbar
Item | Tooltip and shortcut | Description |
|---|---|---|
View Options | Filter out code issues by their severity and configure their sorting. When no grouping or sorting options are selected, the issues are listed in the order they appear in the file. | |
| Show Quick-Fixes Alt+Enter | Show quick-fixes available for the selected problem. |
Open Editor Preview | Open the preview pane to view the selected issue in its source context right in the Problems window. Note that this preview is a normal editor where you can change the code and apply available quick-fixes. |
Context menu
Item | Shortcut | Description |
|---|---|---|
Show Quick-Fixes | Alt+Enter | Show quick-fixes available for the selected problem. |
Copy Problem Description | Ctrl+C | Copy the problem description to the clipboard. |
Jump to Source | F4 | Open the code containing the problem in the editor. |
Show error details | Open error details in a separate dialog. |

Toolbar
Item | Tooltip and shortcut | Description |
|---|---|---|
View Options | Filter out code issues by their severity and configure their sorting. When no grouping or sorting options are selected, the issues are listed in the order they appear in the file. | |
| Show Quick-Fixes Alt+Enter | Show quick-fixes available for the selected problem. |
Open Editor Preview | Open the preview pane to view the selected issue in its source context right in the Problems window. Note that this preview is a normal editor where you can change the code and apply available quick-fixes. | |
Expand All | Expand all nodes. | |
Collapse All | Collapse all nodes. |
Context menu options
Item | Shortcut | Description |
|---|---|---|
Copy Problem Description | Ctrl+C | Copy the problem description to the clipboard. |
Jump to Source | F4 | Open the code containing the problem in the editor. |
Show error details | Open error details in a separate dialog. |
This tab displays code problems detected with Qodana. Qodana allows you to run inspections locally including your IDE, and as a part of CI/CD pipelines.

Toolbar
Item | Tooltip and shortcut | Description |
|---|---|---|
Log in to Qodana | Log in to Qodana Cloud. This action is a prerequisite for linking your project with Qodana Cloud-based reports. Alternatively, you can do it from the main menu: . For more information, refer to Qodana Cloud. | |
Logged in to Qodana | You are logged in to Qodana Cloud. You can link your project with Qodana Cloud. | |
Link Project with Cloud | Link your project and upload the report to Qodana Cloud. Alternatively, you can do it from the main menu: . For more information, refer to Open report from Qodana Cloud. | |
Linked with Cloud | Your project is linked with Qodana Cloud. By clicking this button, you can open the inspection report in the cloud or unlink your project from Qodana Cloud. | |
Refresh Cloud Report | Refresh the current cloud report. | |
View Options | Filter out code issues by their severity and configure their sorting. When no grouping or sorting options are selected, the issues are listed in the order they appear in the file. | |
Open Editor Preview | Open the preview pane to view the selected issue in its source context right in the Problems window. Note that this preview is a normal editor where you can change the code and apply available quick-fixes. | |
Expand All Ctrl+NumPad + | Expand all nodes. | |
Collapse All Ctrl+NumPad - | Collapse all nodes. | |
Show Qodana in Browser | Open the results of the analysis in your default browser. An interactive report opens allowing you to examine the problems in detail and navigate between the report and the IDE. |
Context menu options
Item | Shortcut | Description |
|---|---|---|
Show Quick-Fixes | Alt+Enter | Show quick-fixes available for the selected problem. |
Jump to Source | F4 | Open the code with the problem in the editor. |
Show Error Details | Learn more in formation about the detected problem in a popup. | |
qodana.yaml | Modify the qodana.yaml configuration file by excluding from the analysis certain files, folders, or inspections. |
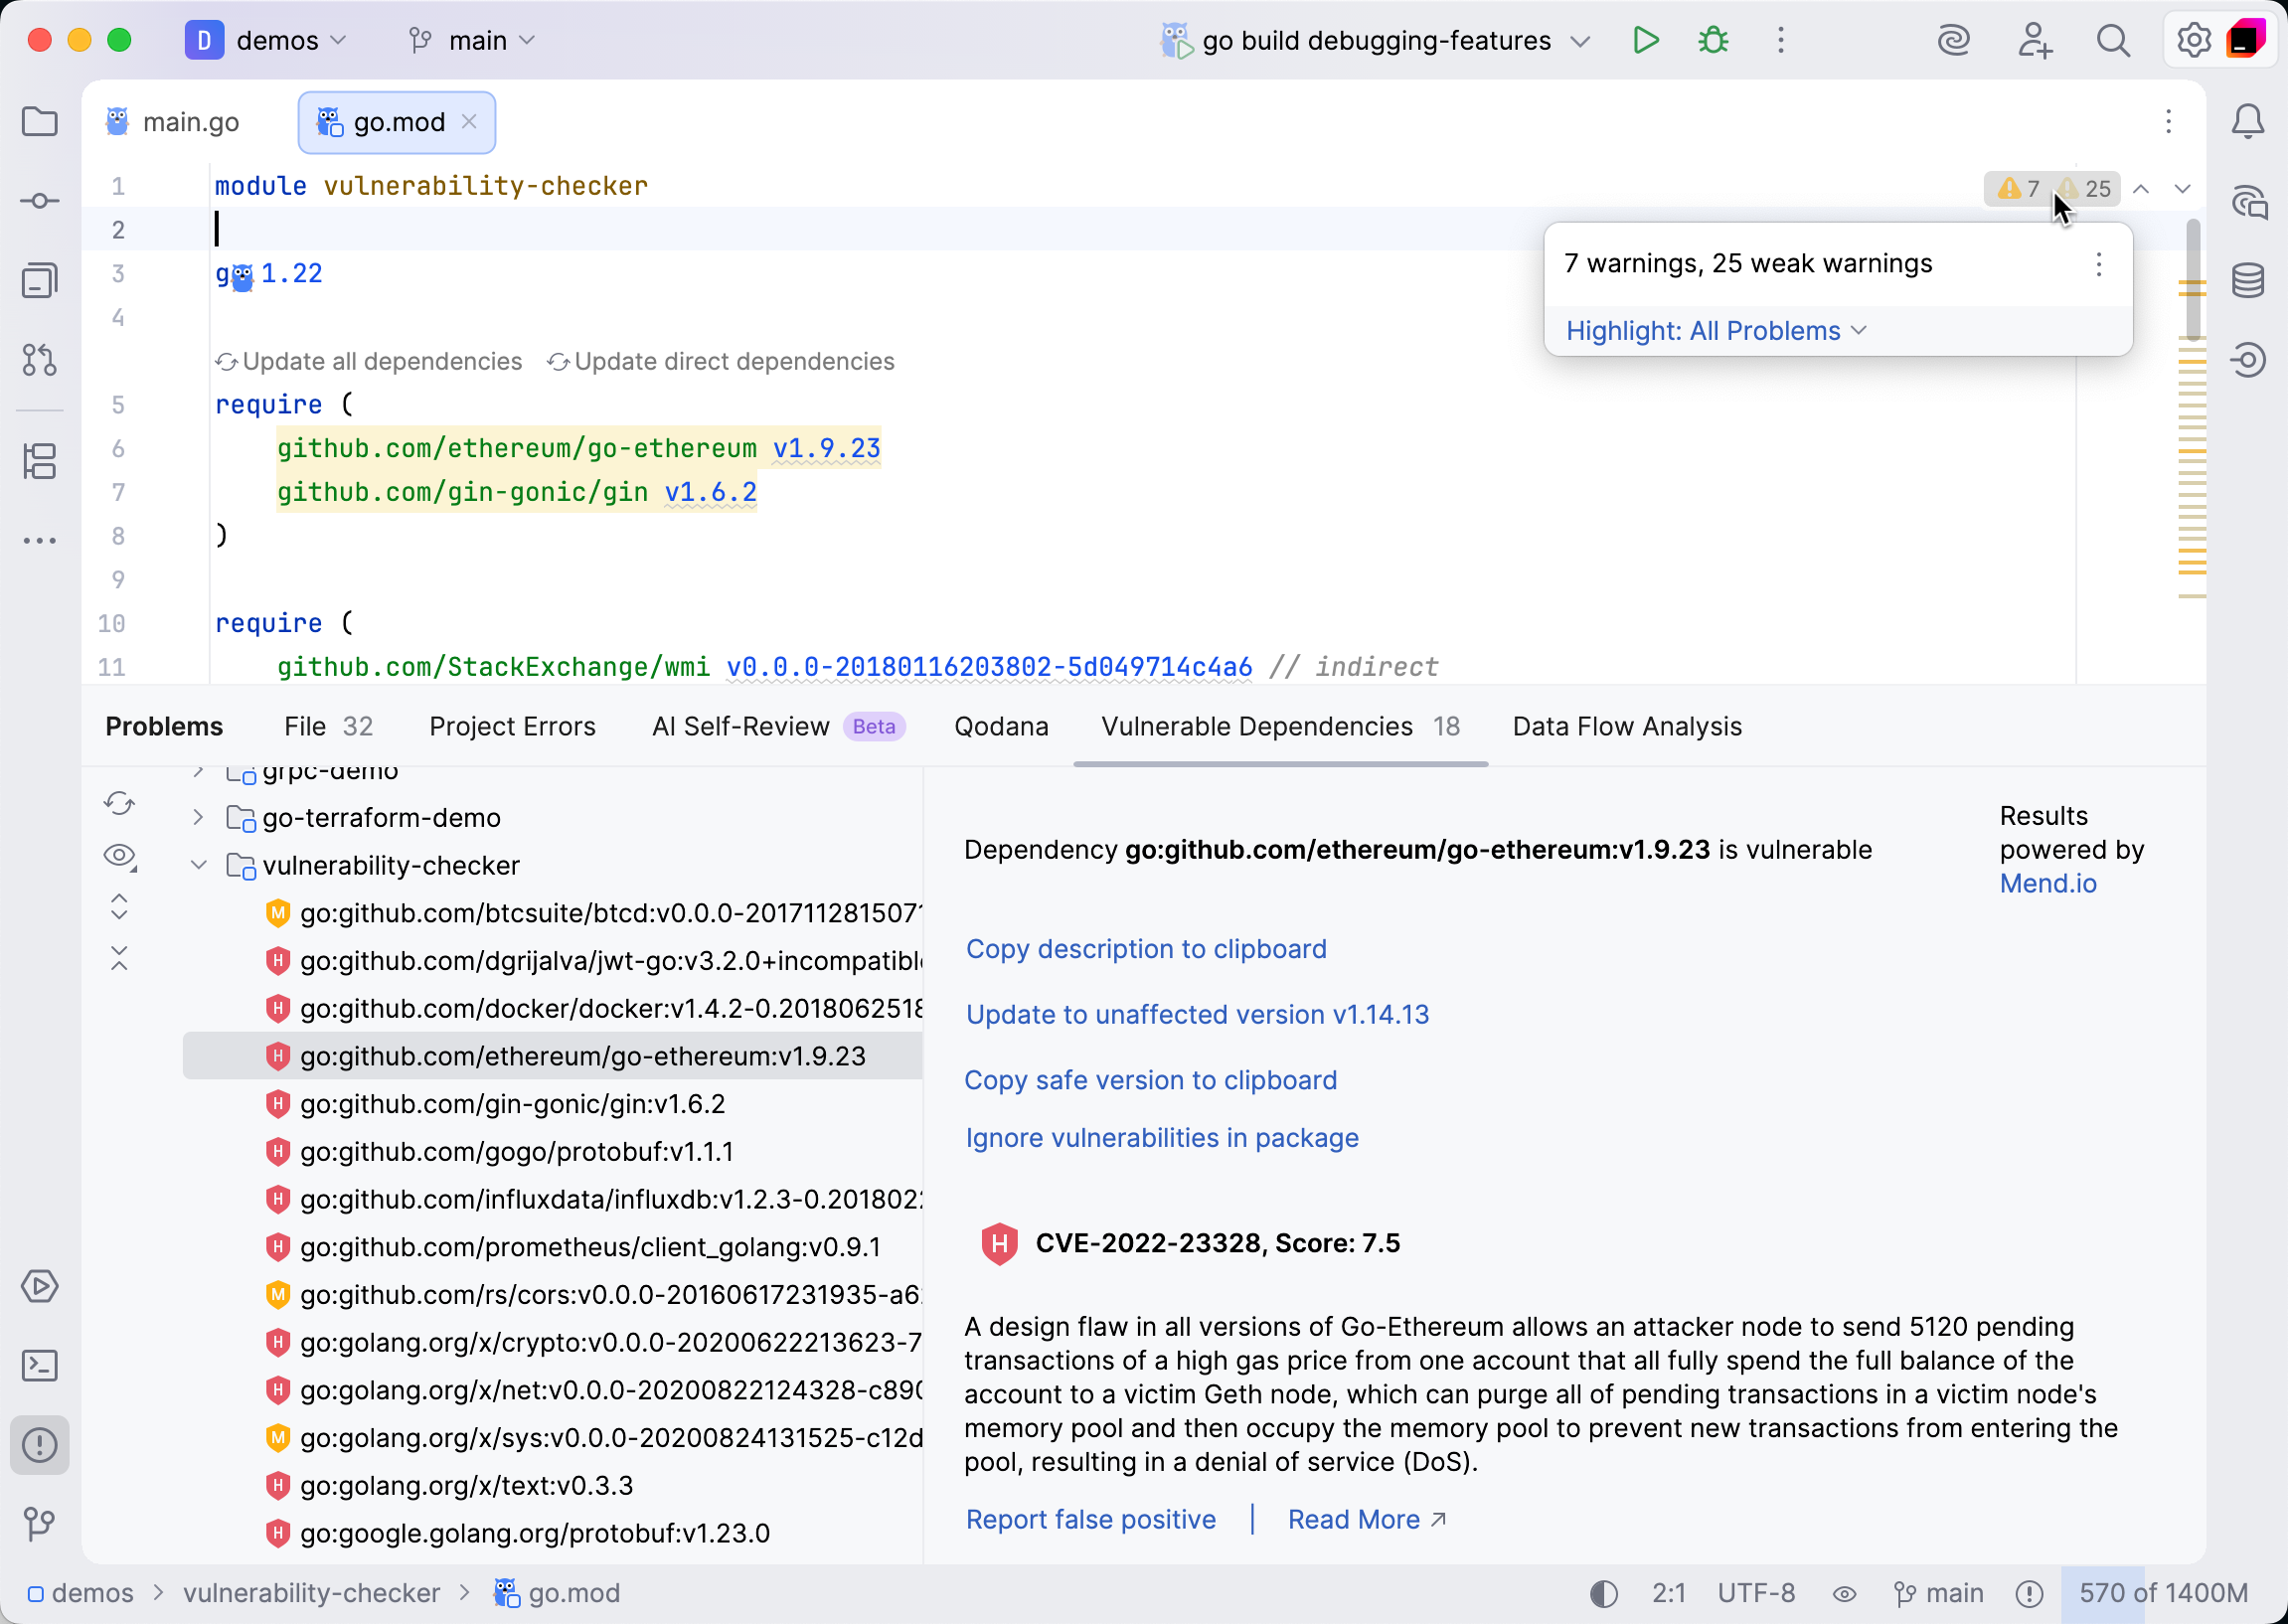
This tab displays usages of vulnerable API that are found in imported dependencies.

Toolbar
Item | Tooltip and shortcut | Description |
|---|---|---|
Refresh | Check the current dependencies in the go.mod file and refresh the list in the Problems tool window. | |
Show Safe Dependencies | Show safe dependencies in the list along with vulnerable dependencies. | |
Expand All Ctrl+NumPad + | Expand all nodes. | |
Collapse All Ctrl+NumPad - | Collapse all nodes. |
Action links in the results pane
Item | Description |
|---|---|
Copy safe version to clipboard | Copy the version that includes a fix for the vulnerability to the clipboard. |
Report false positive | Inform JetBrains about inaccuracies in the dependency vulnerability checker. Dependency vulnerability checker automatically scans your code to identify potential issues such as security vulnerabilities in your dependencies. However, like any automated tools, they may sometimes identify an issue that is not really a problem (a "false positive"). The Report false positive option allows users to report these inaccuracies back to the developers of the IDE. |
Read more | Open Mend.io Vulnerability Database to learn more about the vulnerability. |
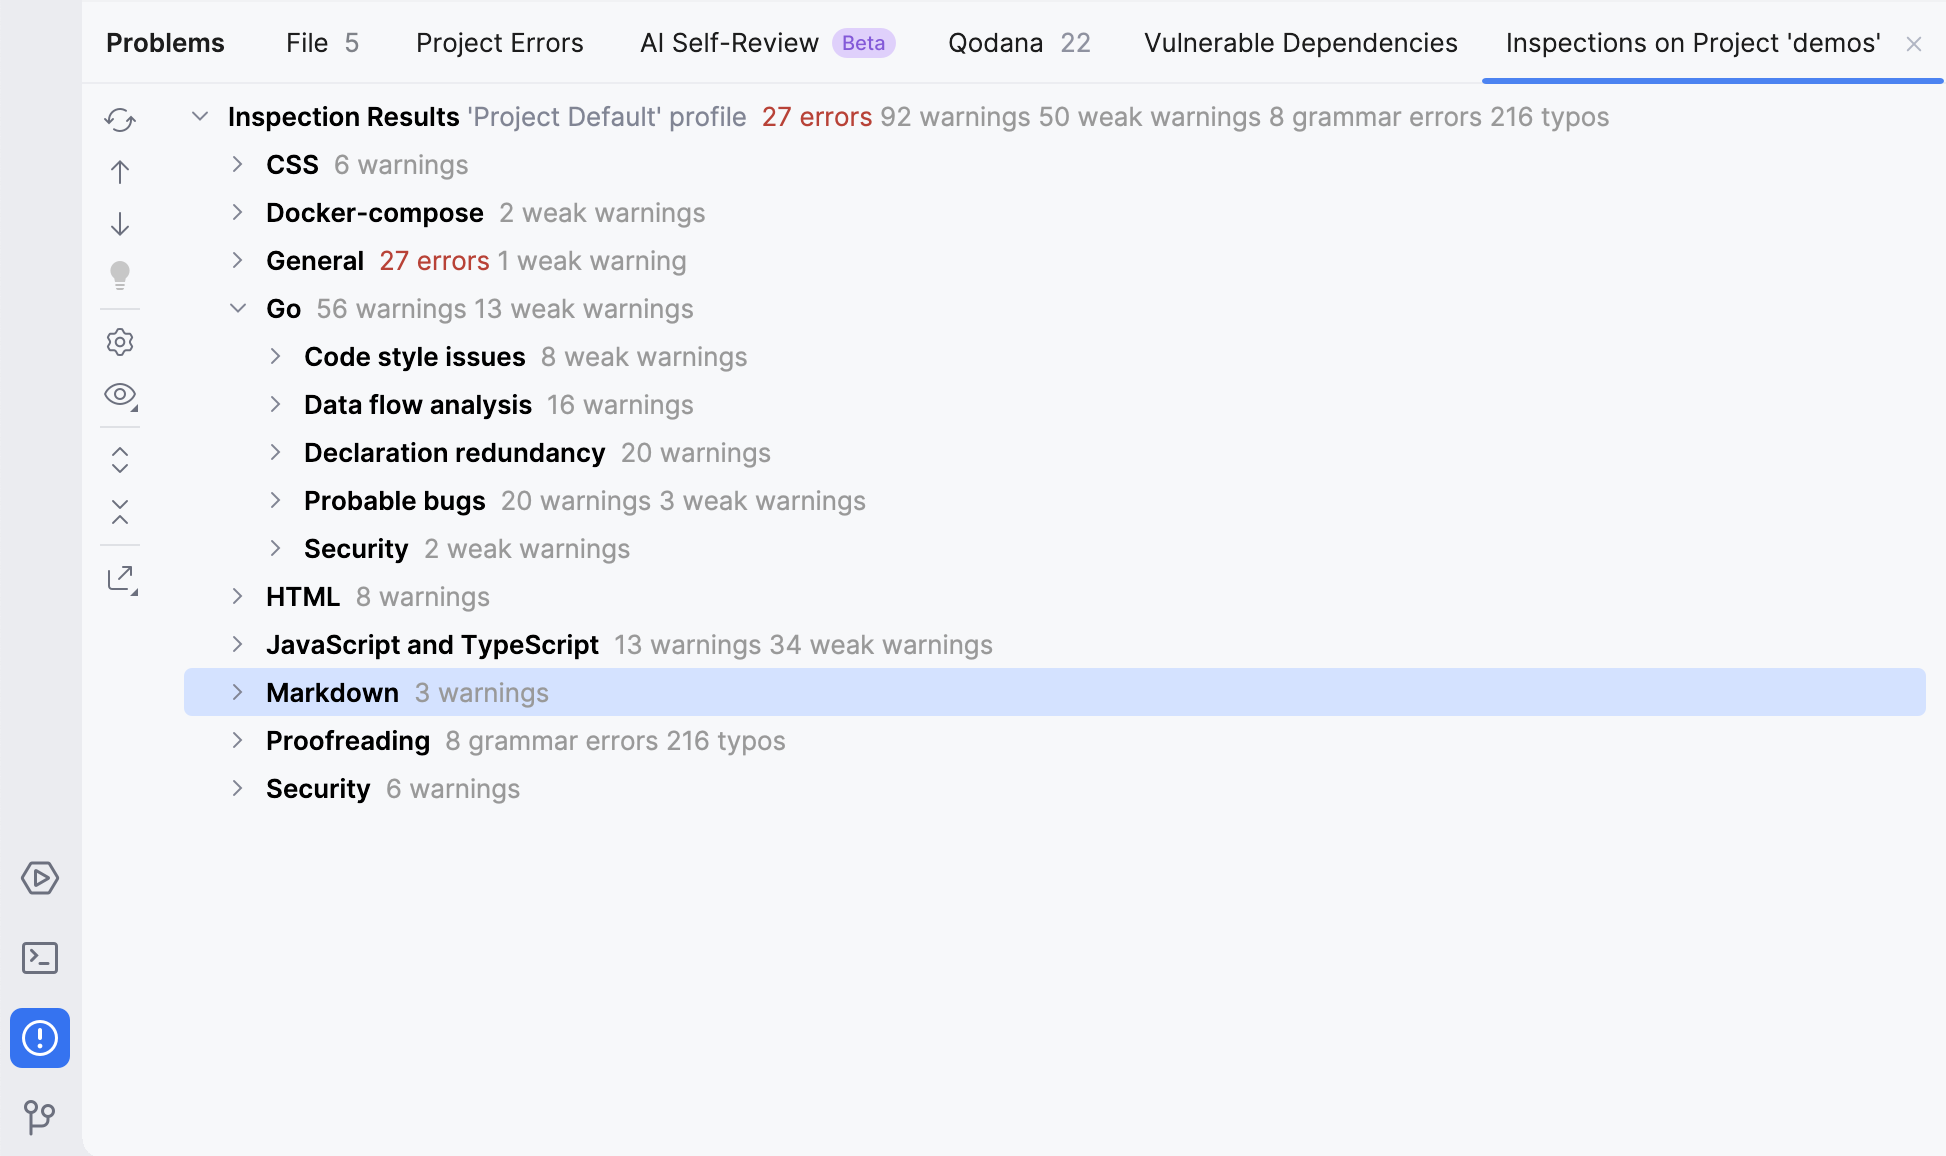
This tab appears when you run code inspections manually and shows the analysis results.

Toolbar
Item | Shortcut | Description |
|---|---|---|
Ctrl+F5 | Run the inspection and show the results on the same tab. | |
Ctrl+Alt+Up | Navigate to the previous problem. | |
Ctrl+Alt+Down | Navigate to the next problem. | |
| Alt+Enter | Resolve the problem for the selected inspection item by choosing one of the available quick fixes from the list. |
Change the settings for the selected inspection or group of inspections in the Errors dialog. | ||
Group or filter found problems according to the selected option:
| ||
Ctrl+NumPad + | Expand all nodes. | |
Ctrl+NumPad - | Collapse all nodes. | |
Export the inspection results into XML , Sarif, or HTML format. |
Context menu options
Item | Shortcut | Description |
|---|---|---|
Jump to Source | F4 | Open the file that contains the selected problem in the editor and place the caret at the beginning of the corresponding code fragment. |
Exclude | Delete | Exclude the selected items from further examination. Excluded nodes are shown strikethrough. If the filter toggle |
Include | Insert | Include previously excluded items in the list of results. All nested elements are included too. |
| Alt+Enter | Select one of the suggested solutions. |
Suppress problem | Suppress the inspection for the selected problem or the selected class. | |
Edit Settings | Change the settings for the selected inspection or group of inspections in the Errors dialog. | |
Disable inspection | Disable alerts for the selected inspection in the active tab of results. If the filter toggle | |
Run inspection on | Rerun the selected inspection and display the results on a new tab. |
Inspection report
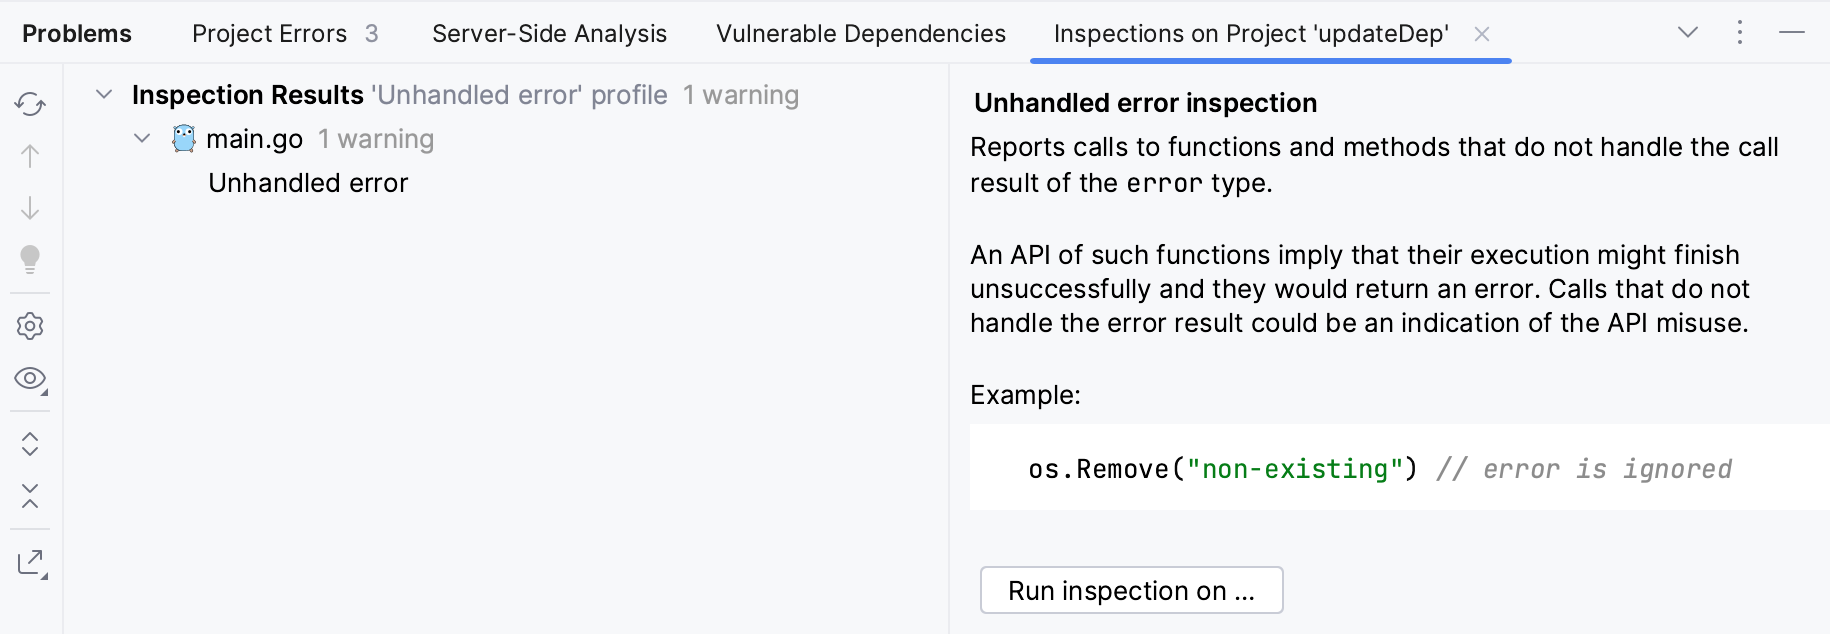
The inspection report is shown in the right pane of the results tab when an inspection node is selected in the left pane. The report may include the following:
Problem resolution: A button for each of the available solutions. Clicking a button invokes the corresponding fix. If no buttons are present, you have to fix the problem yourself.
Suppress: Click this button to reveal the list of inspection suppress options.
Problem synopsis: A brief description of the problem.
Disable inspection: Disable alerts for the selected inspection in the active tab of results. If the filter toggle
is on, the nodes for disabled inspections are hidden.
Run inspection on: Rerun the selected inspection and display the results on a new tab.