Metrics
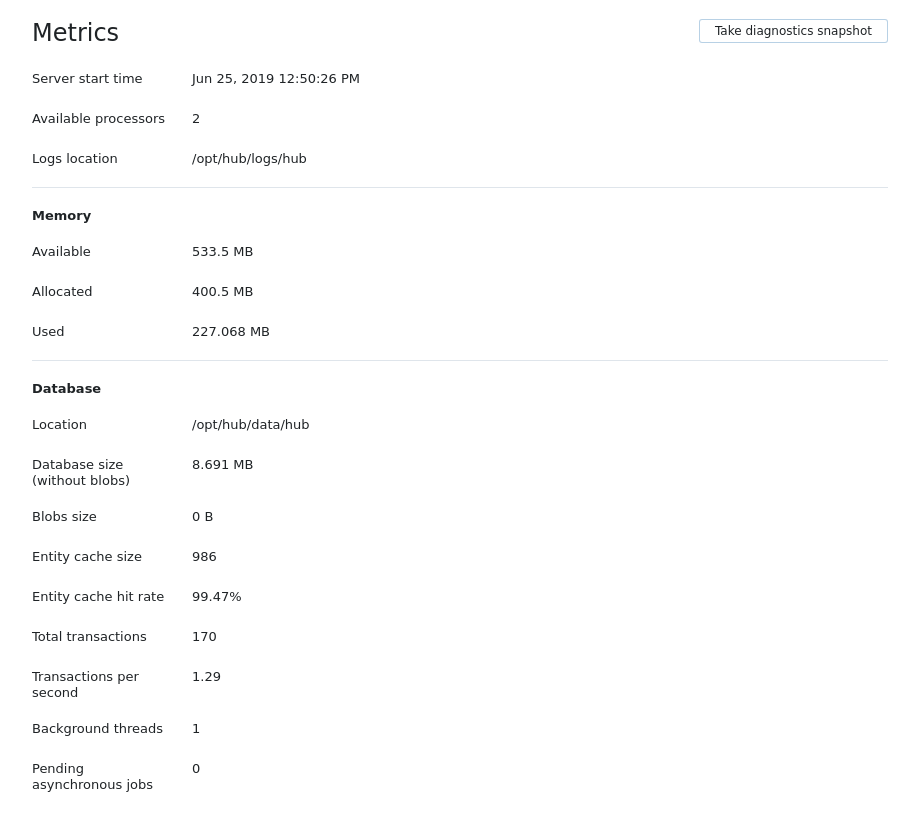
On the Metrics page, you can monitor the metrics of your Hub server, including:
Server uptime
Hardware characteristics
Database parameters

The Metrics page displays a collection of metrics that you can use to monitor the performance of your Hub installation. When users report that the application is slow or unresponsive, use these metrics to help diagnose the problem.
Metric | Description |
|---|---|
Server start time | The date and time of the last Hub service start. There are certain database problems that can only be discovered on application restart. This information can help you determine which of your backups has a valid database that you can restore to should you encounter problems with your database. |
Available processors | The number of cores that are capable of running Hub. The number of processors that you need to run Hub varies based on the number of users and the number of transactions they perform on a regular basis. However, we don't generally recommend that you run YouTrack on a machine that has fewer than two cores. |
Logs location | The path to the current location of your Hub log files. As with the database, there is a default location for storing log files, but logs can also be stored in a custom location. When you report a problem to our customer support team, they often ask you for copies of these files. This information helps you find these files quickly. |
Memory Metrics
The following information is displayed in the Memory section of the Metrics page.
Metric | Description |
|---|---|
Available | The total amount of free JVM heap memory that is currently available to your Hub service. For best performance, this number should always be larger than the Database Size without BLOBs. If your database is larger than the amount of heap memory that is available to the JVM, consider the following actions:
|
Allocated | The peak amount of memory that has been allocated to the JVM that runs your Hub service. In most cases, your Hub installation will have used as much memory as has been allocated to the JVM during peak use. However, if you have overallocated memory, this number can be significantly lower than the Available memory. Use this metric to determine whether you can safely reduce the amount of heap memory that is available to the JVM without going below the minimum requirement. |
Used | The amount of JVM heap memory currently being used by your Hub service. Compare this value to the Allocated memory to measure your current memory usage versus the peak amount of memory that has been allocated to the JVM. You should also compare this value with the Available memory. If you are consistently using most of the Available memory, consider increasing the maximum Java heap size. |
Database Metrics
The following information is displayed in the Database section of the Metrics page.
Metric | Description |
|---|---|
Location | The path to the current location of your Hub database. Each installation package has a default location for storing database files. However, you or another administrator can change this location. This information simply helps you find where Hub stores data files without having to search for the files on the server. |
Database size (without blobs) | The total size of the database, excluding binary large objects (BLOBs). Images and other attachments are stored as BLOBs, as are large blocks of text in description fields. The amount of space that on the server that is occupied by these objects is excluded from this calculation. Compare this metric with the Available memory to determine whether you need to increase the amount of memory or reduce the size of your database. |
Blobs size | The total amount of space on the database that is used to store binary large objects (BLOBs). |
Entity cache size | The number of records that are held in the cache for search query results. Cached results improve the performance of search queries against the database. |
Entity cache hit rate | The percentage of search queries that are satisfied by results that are stored in the cache. A high percentage means that there are fewer queries that have to run against the database itself, which is good. Check this metric when users complain about poor search performance. If this percentage is lower than 50%, it can indicate that there is insufficient storage space allocated to the cache. To investigate this issue, submit a support request. |
Total transactions | The number of database transactions that have been processed since the last service start time. You can compare this number to the Uptime to measure the average overall server load. |
Transactions per second | The average number of database transactions that are processed each second. Measures the immediate server load. Check this metric when users experience general performance issues. It may be that your server is processing an unusually high number of transactions. |
Background threads | The number of dedicated threads that populate the database queries cache. A healthy server normally requires only one or two threads to perform these tasks. This number is calculated statically on server start and remains constant. |
Pending asynchronous jobs | The number of tasks that are waiting to be executed, usually background tasks that populate the database queries cache. On a powerful server, you should see that this queue of tasks is processed fairly quickly. If you see an abnormally high value that remains unchanged or grows in value, your server is experiencing problems. To resolve this problem, you can switch the server to read-only mode until the queue returns to normal levels. For more information, see System Settings. |