Guest Dashboard
You can configure a dashboard that is displayed by default to guest users. This dashboard can provide an overview of your projects to visitors, customers, and external users.
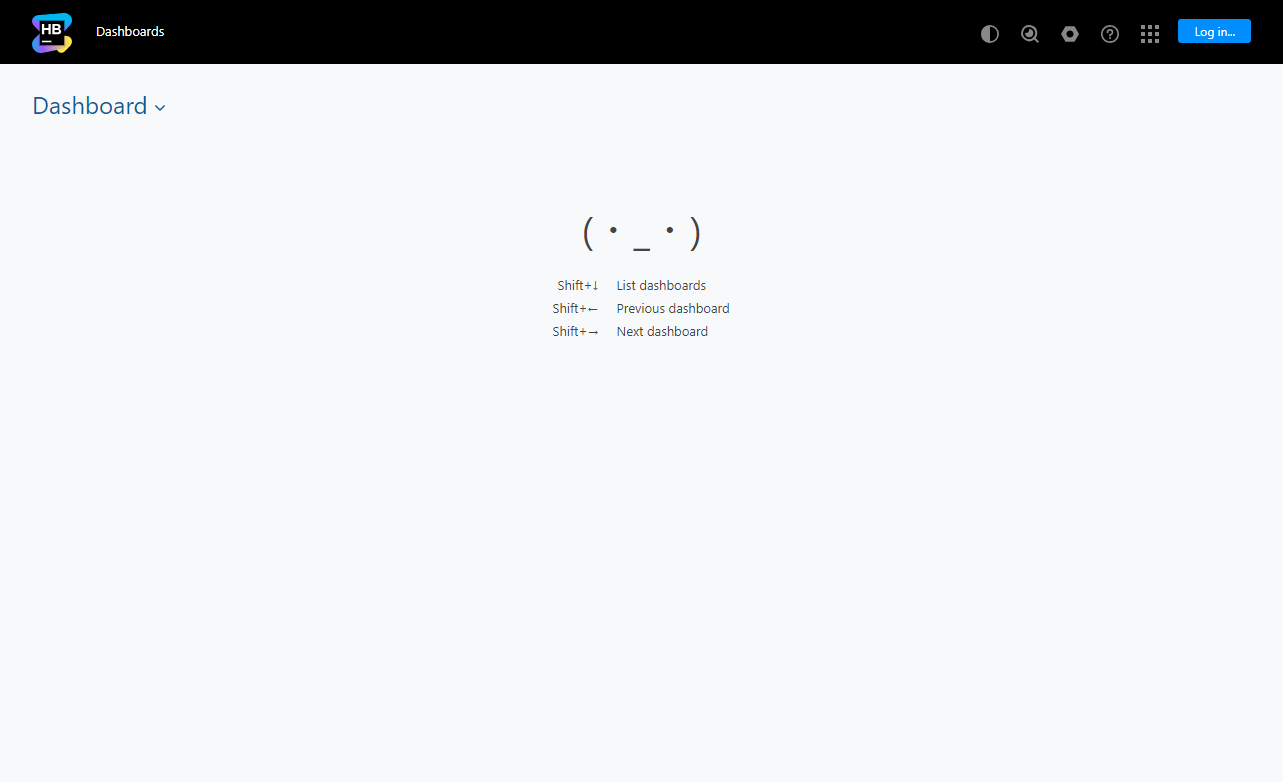
If you don't configure the guest dashboard, all your visitors see is this:

Surely, you can do better.
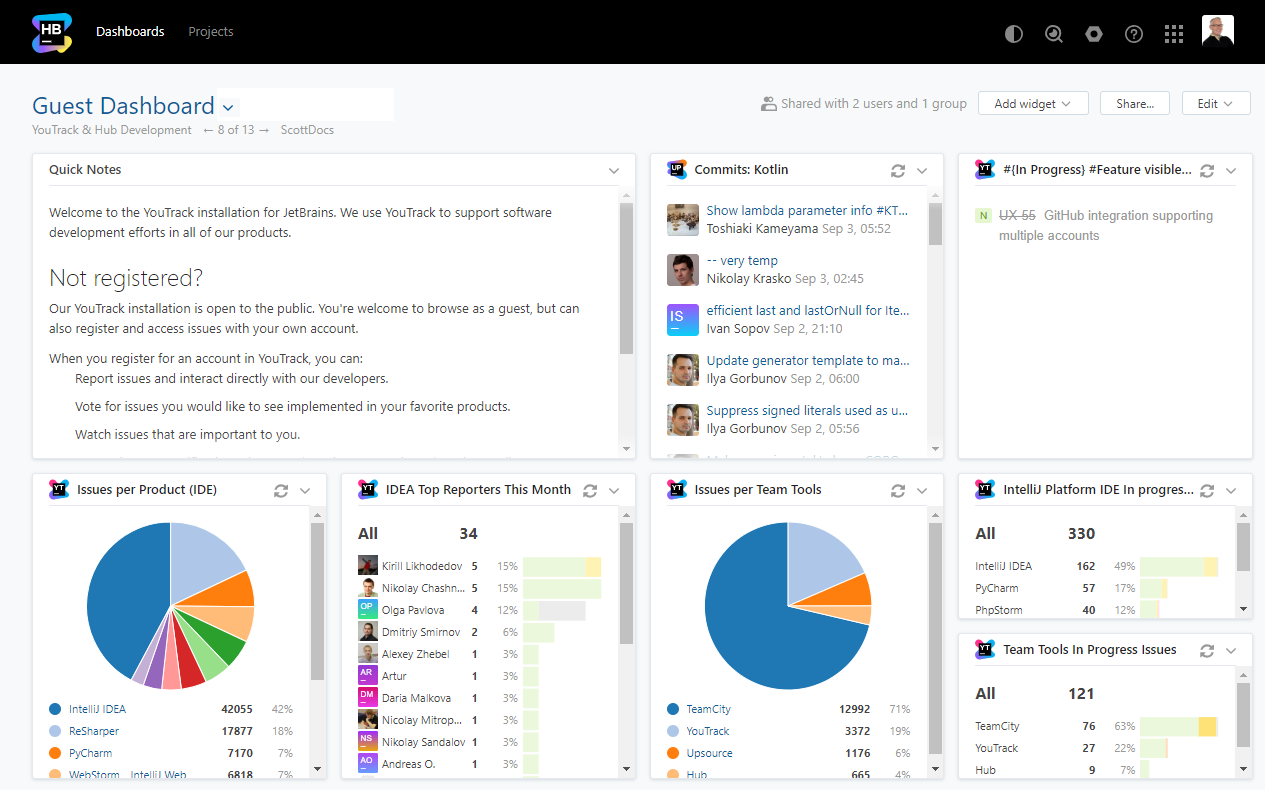
Take a look at a guest dashboard that we built for the JetBrains YouTrack installation.

Guest users can see all of the following information at a glance:
Instructions for registering an account in our tracker.
The top issue reporters in the IntelliJ IDEA project.
The distribution of issues in our major projects.
Recent commits in the Kotlin project.
A list of public features that are currently in development.
The breakdown of issues in progress for our IDEs and team tools.
The best part is that all of these widgets are interactive. The projects that are shown on the dashboard are visible to guest users. This means that visitors can click through and view the public details of issues, code reviews, and commits that are shown in the report widgets.
This guide shows you what you can do to pretty up this page.
Prerequisites
To edit the default dashboard, you need the Project Update permission in the Global project. This gives you access rights to view and add widgets to the dashboard for all of the JetBrains team tools that are connected to Hub.
Step 1 — Collect your Content
The first step is to curate content that you think would be interesting to visitors and guests. Think about your dashboard as if it were an art gallery. Carefully consider which pieces you want to put on display. When in doubt, collect more than you need. You can set up a permanent collection and a rotating exhibition.
Quick Notes widgets let you display whatever message you want to show on your dashboard. Consider adding a notes widget that introduces visitors to the content and explains the context.
If guest users can report issues in YouTrack, generate a pre-configured issue template URL and insert it in a notes widget.
You can use Markdown to format your text any way you want, add images, and insert links to other resources.
If your Hub instance is connected to TeamCity, ask your project managers if there is any information they want to share on the dashboard. TeamCity has an option to enable guest login. This option lets anonymous users monitor the status of a project. If guest access is enabled in TeamCity, you can use a project status widget to display a list of builds for a TeamCity project.
If your Hub instance is connected to a YouTrack service, you can display lists of issues that match specific filter criteria. Here are few possibilities:
Display a list of issues with the
reported by: mesearch query. This type of list is especially useful when you have a dedicated project to collect feedback. Guest users see a list of issues that they have reported themselves and issues that were reported by other guests.List the issues that are currently in progress for your projects.
Feature a list of issues that were resolved during the week.
Step 2 — Round Up Reports
You can only add YouTrack report widgets for existing reports to your dashboard.
Talk to your project teams and find out if they already have any reports that would be interesting for visitors. When you see a report you like, you can either ask the owner to share it or create a clone for you to use on the dashboard.
Be careful with the report settings. The report should be visible to the All Users group. If you add a report widget that is not visible to this group, guest users only see an access error.
Step 3 — Deck Out your Dashboard
Once you've assembled all of your content, you're ready to build your dashboard.
To configure the default dashboard:
Click the Dashboard link in the header.
From the dashboard list, select the guest dashboard. In older installations, the name of the guest dashboard is Default. In newer installations, the name is Dashboard. To choose the right one, select the dashboard that displays guest as its owner.
Rename it. Dashboard is boring. Default is worse.
Click the Edit button and select the Rename option.
Enter a new name and click the Save name button.
Click the Add widget button and select the type of widget that you want to display.
Configure the widget settings and click the Create widget button to save the widget to the dashboard.
Repeat steps 4 and 5 until you have added all of your content.
Organize the content.
Drag each widget to the desired location.
Drag the edge of a card to set the height and width. The size of the card automatically snaps to the closest intersection of the grid.
Step 4 — Roll Out the Red Carpet
When your dashboard is ready, spread the word! Add links to the dashboard to your website and marketing campaigns. Tweet about it. Invite visitors to learn more about your products and encourage customers to participate in your development process.
The dashboard is a great tool for engaging with the public and broadcasting your efforts. Your team works hard — it's OK to show off a little.