View analytics and reports
Toolbox Enterprise automatically collects the following data from the connected IDEs:
Anonymous feature usage statistics as JSON files
IDE error information (exceptions, freezes)
The collected data is stored in the connected Object Storage (an AWS S3-compatible bucket). You can use third-party tools to process this data. In this scenario, the reports are written to the S3-compatible bucket under the analytics/batch_ID path. Event logs are stored as JSONs, and information about UI freezes – as ZIP files.
You can access the preferred S3-compatible storage using the Big Data Tools plugin or the means provided by your cloud vendor (for example, Minio Web UI).
In addition to the manual data collection possibilities, the Toolbox Enterprise Server offers built-in analytics on top of the collected data:
IDE versions in use
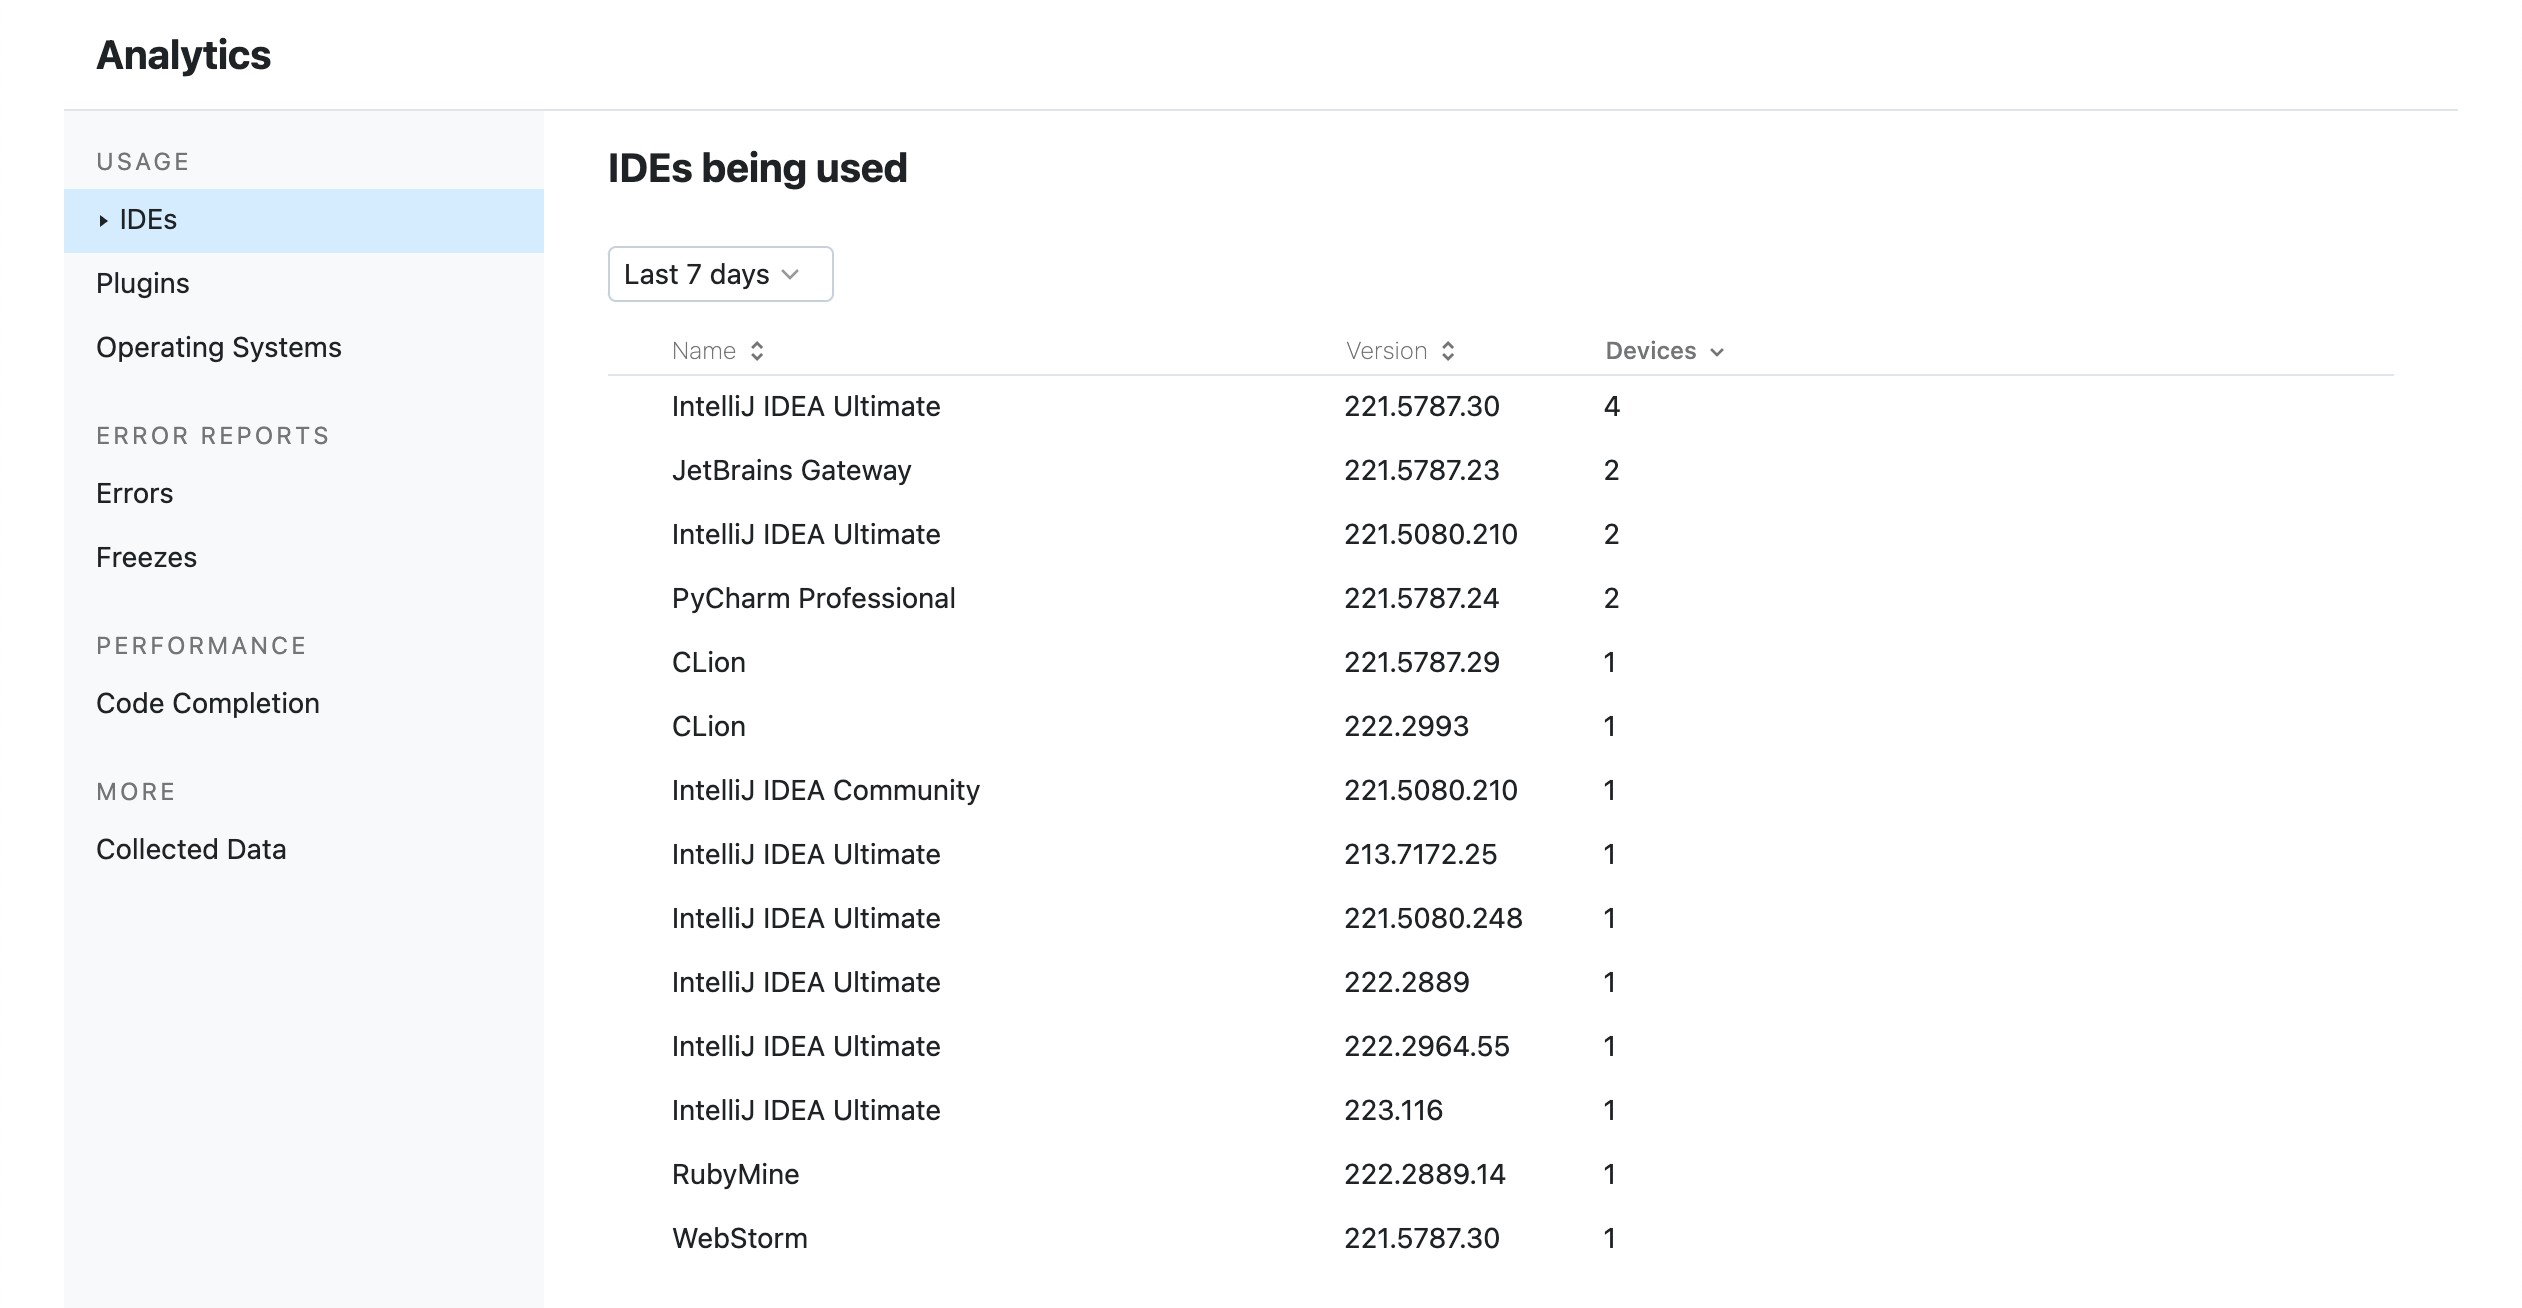
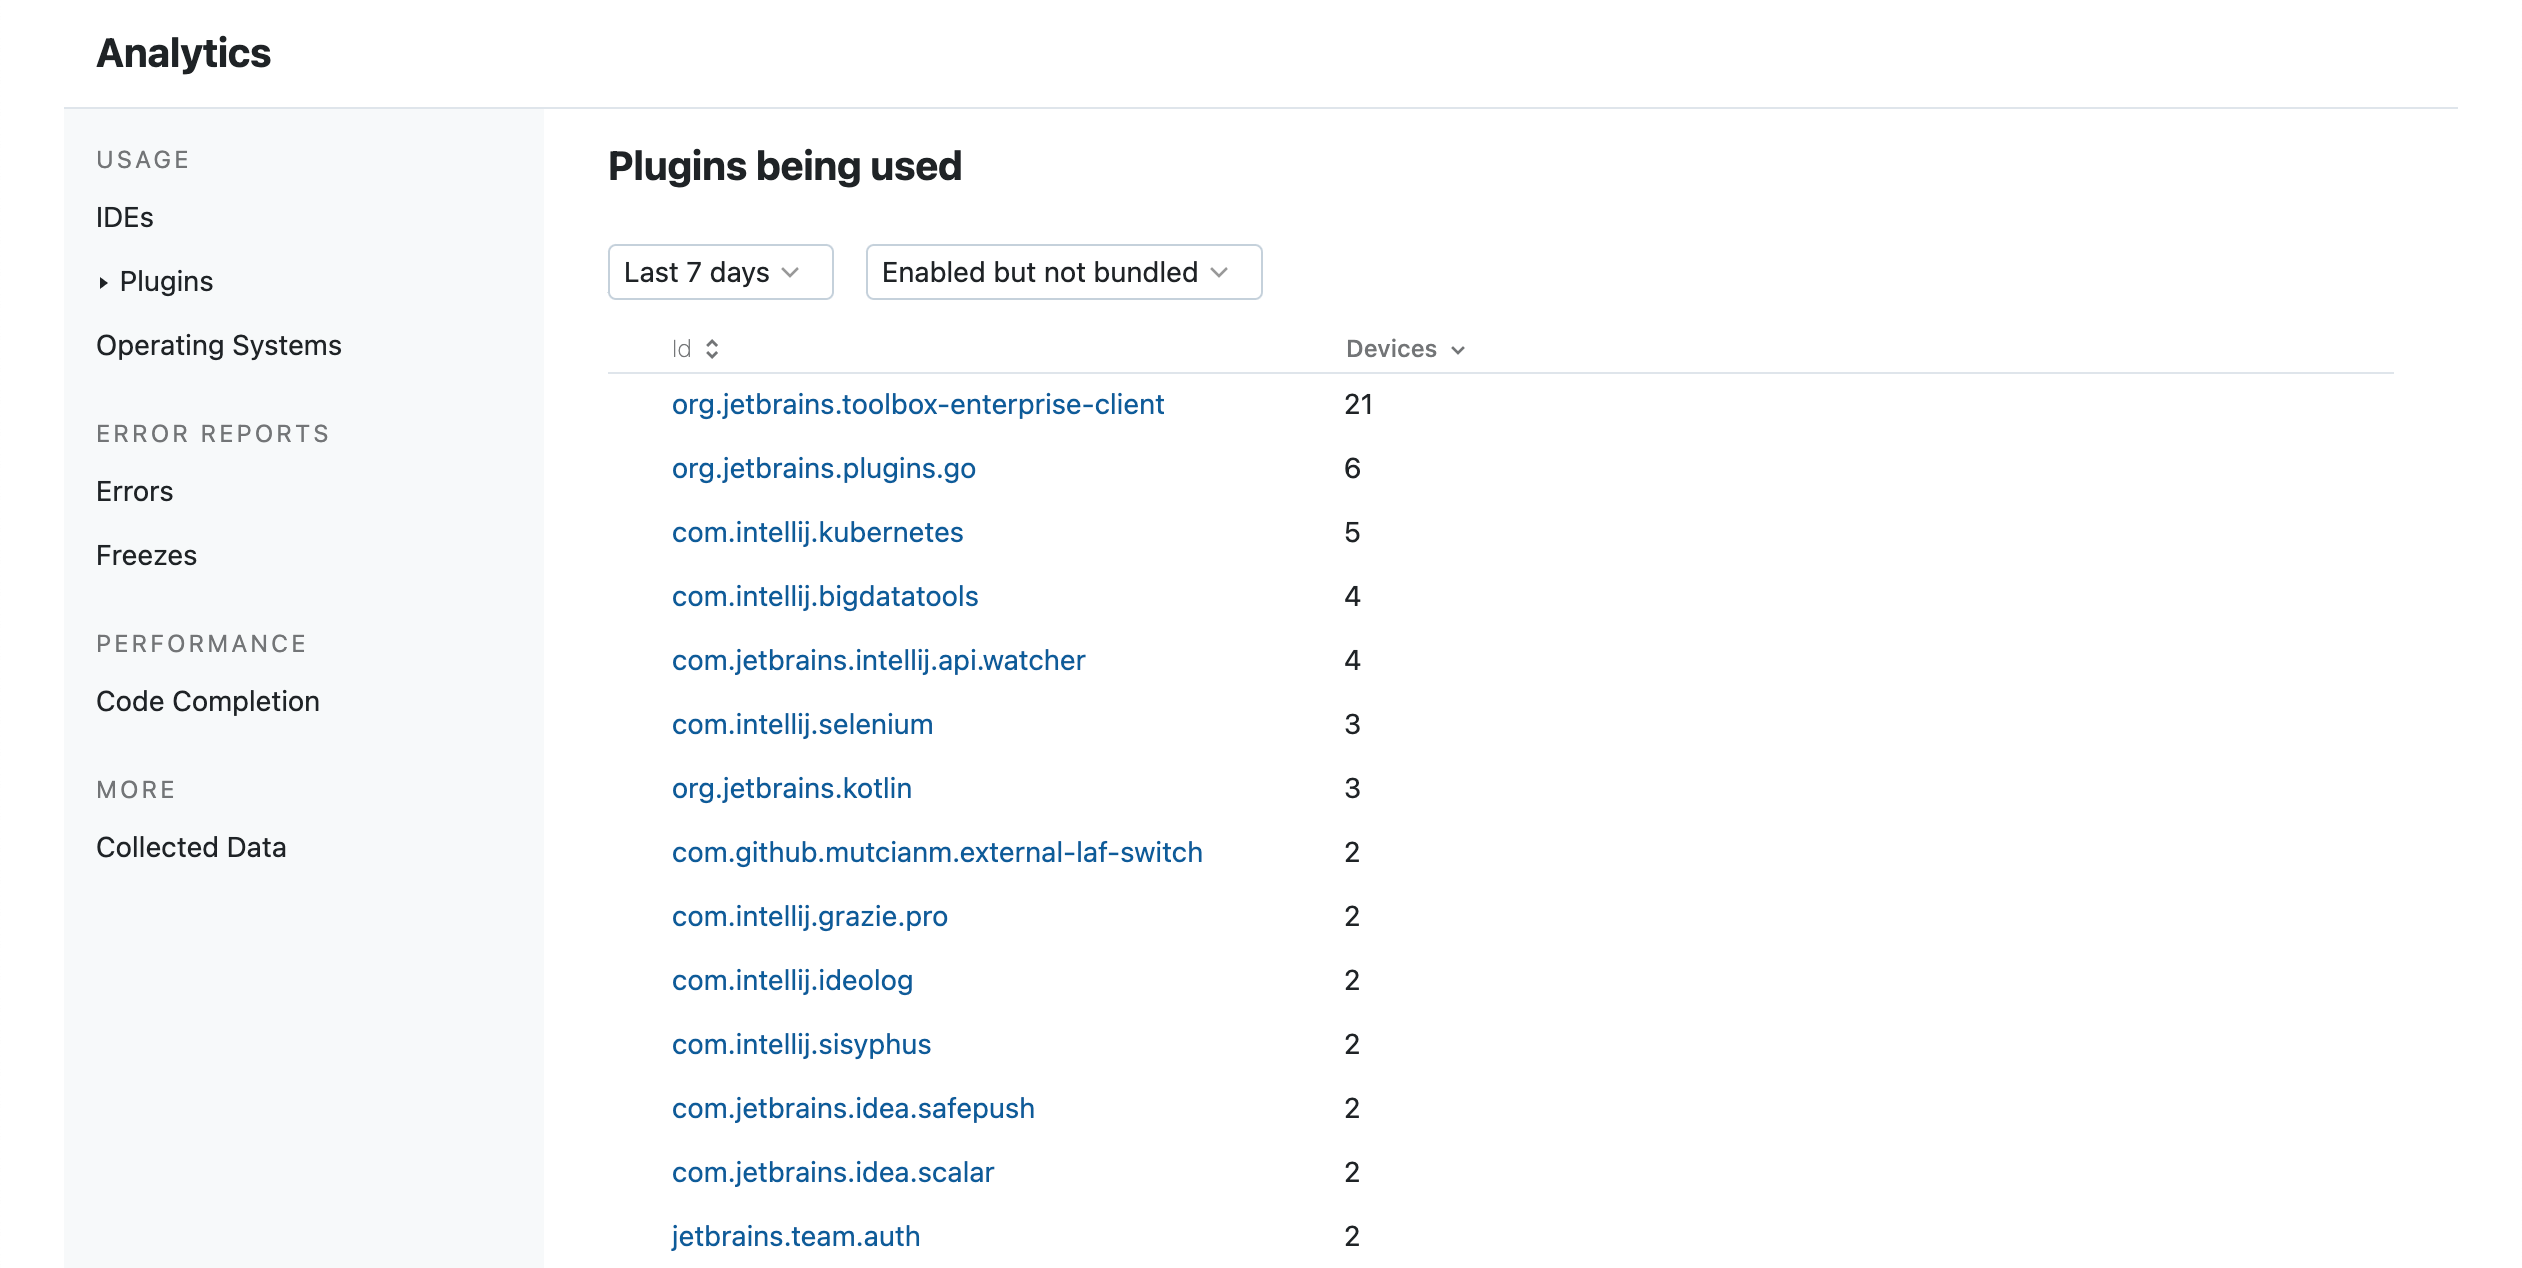
Names and versions of custom IDE plugins in use
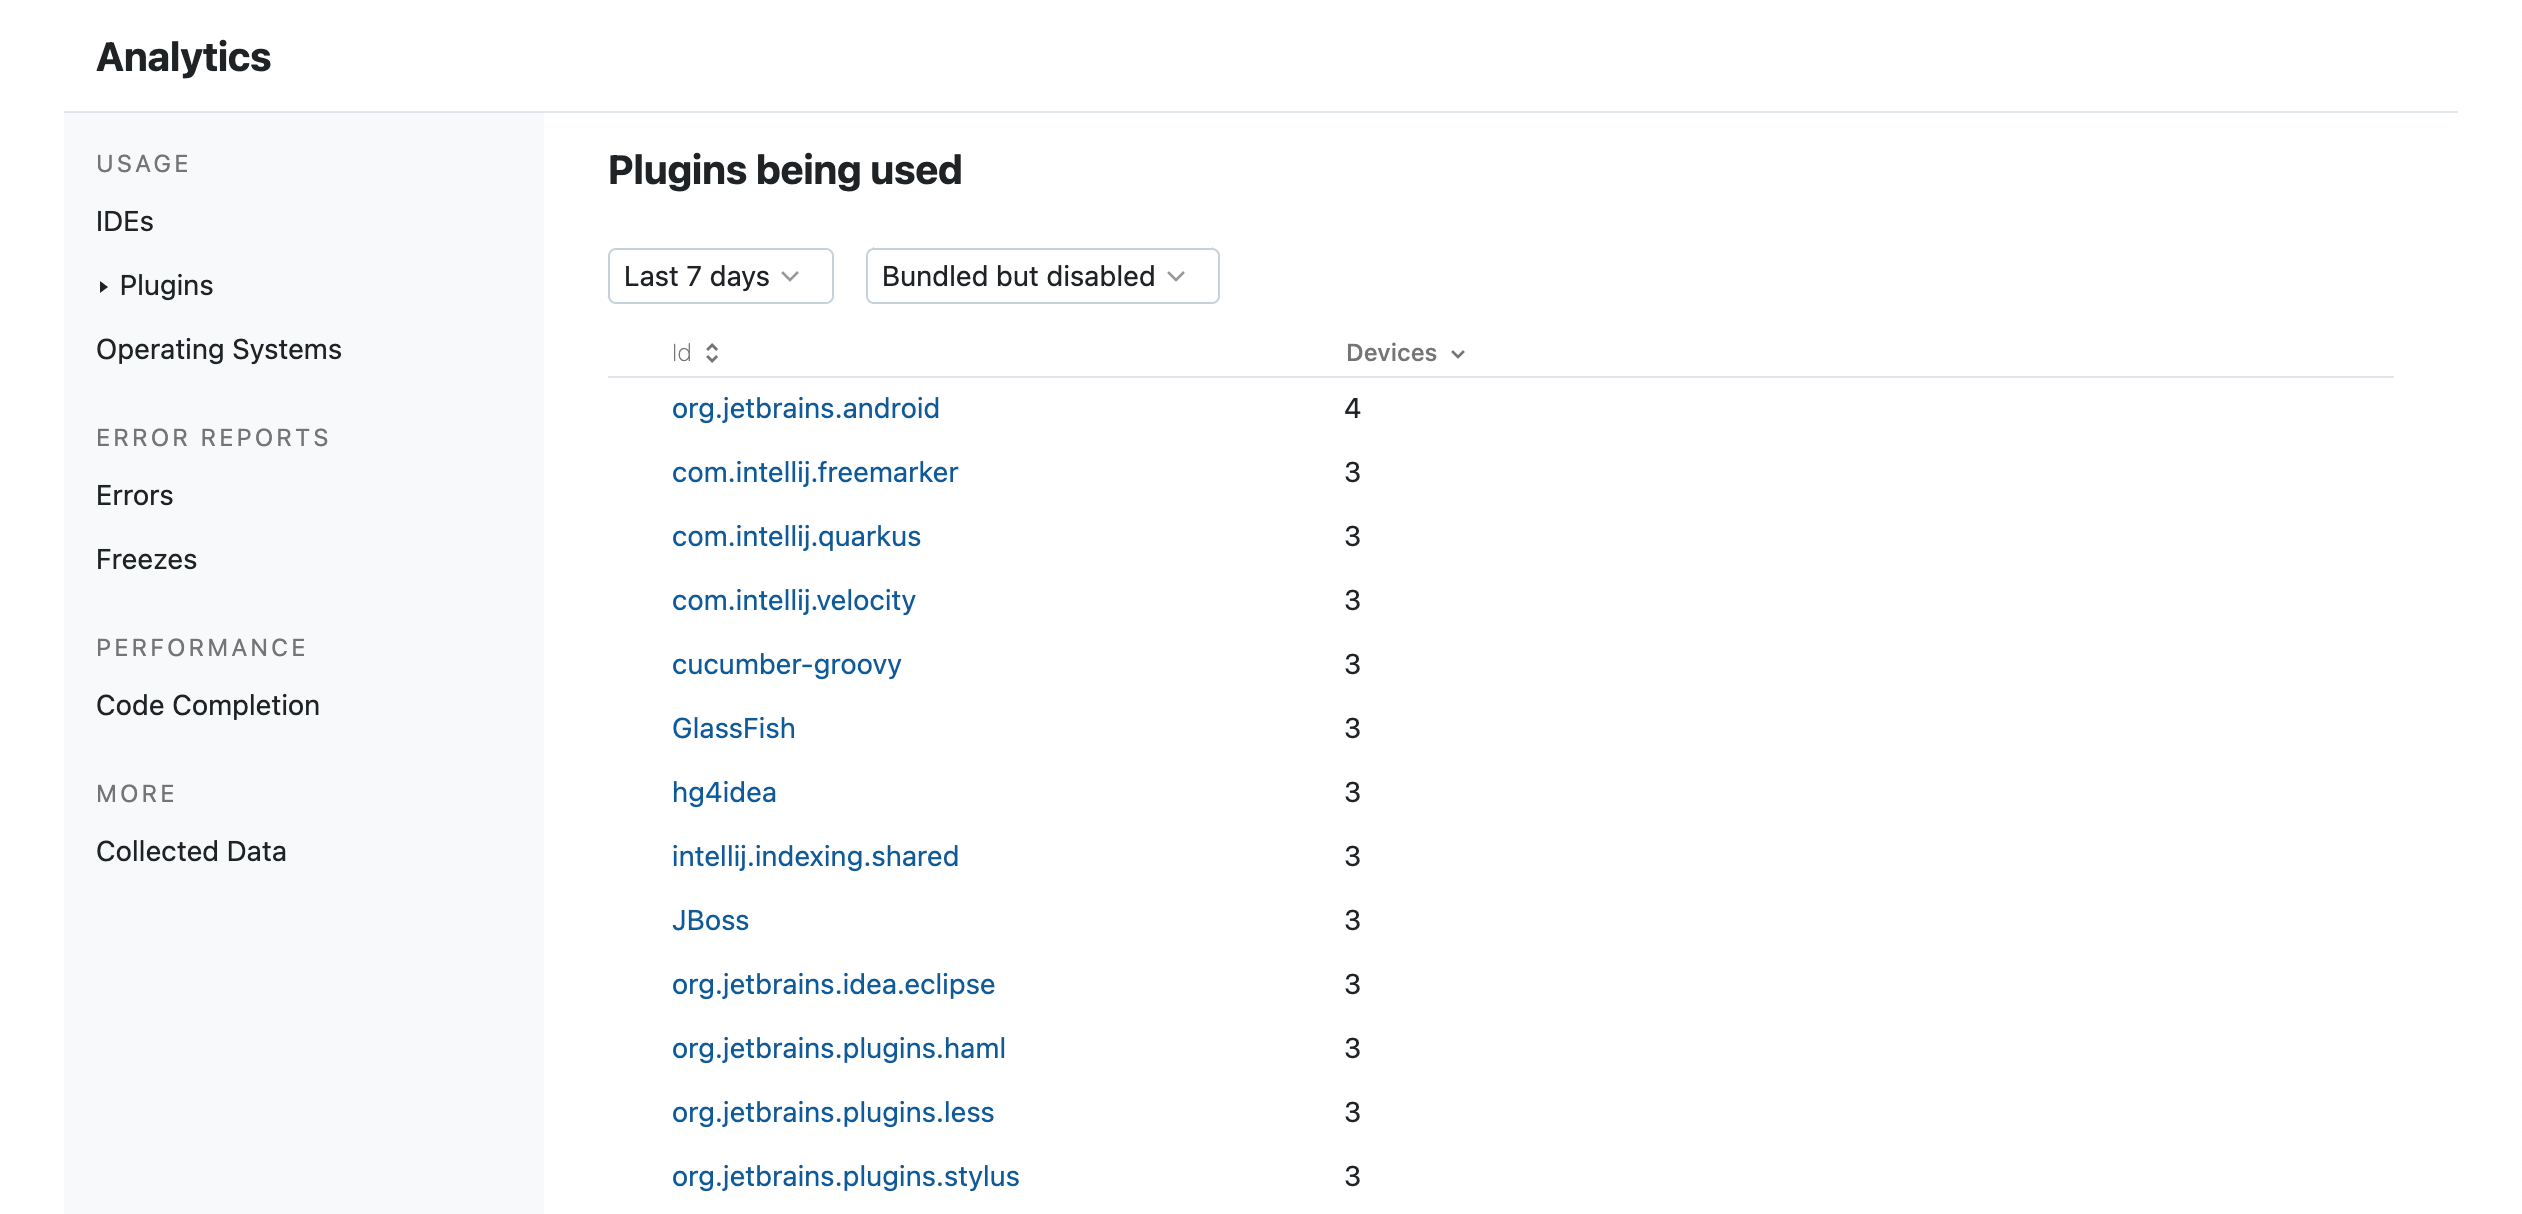
Bundled IDE plugins that were disabled
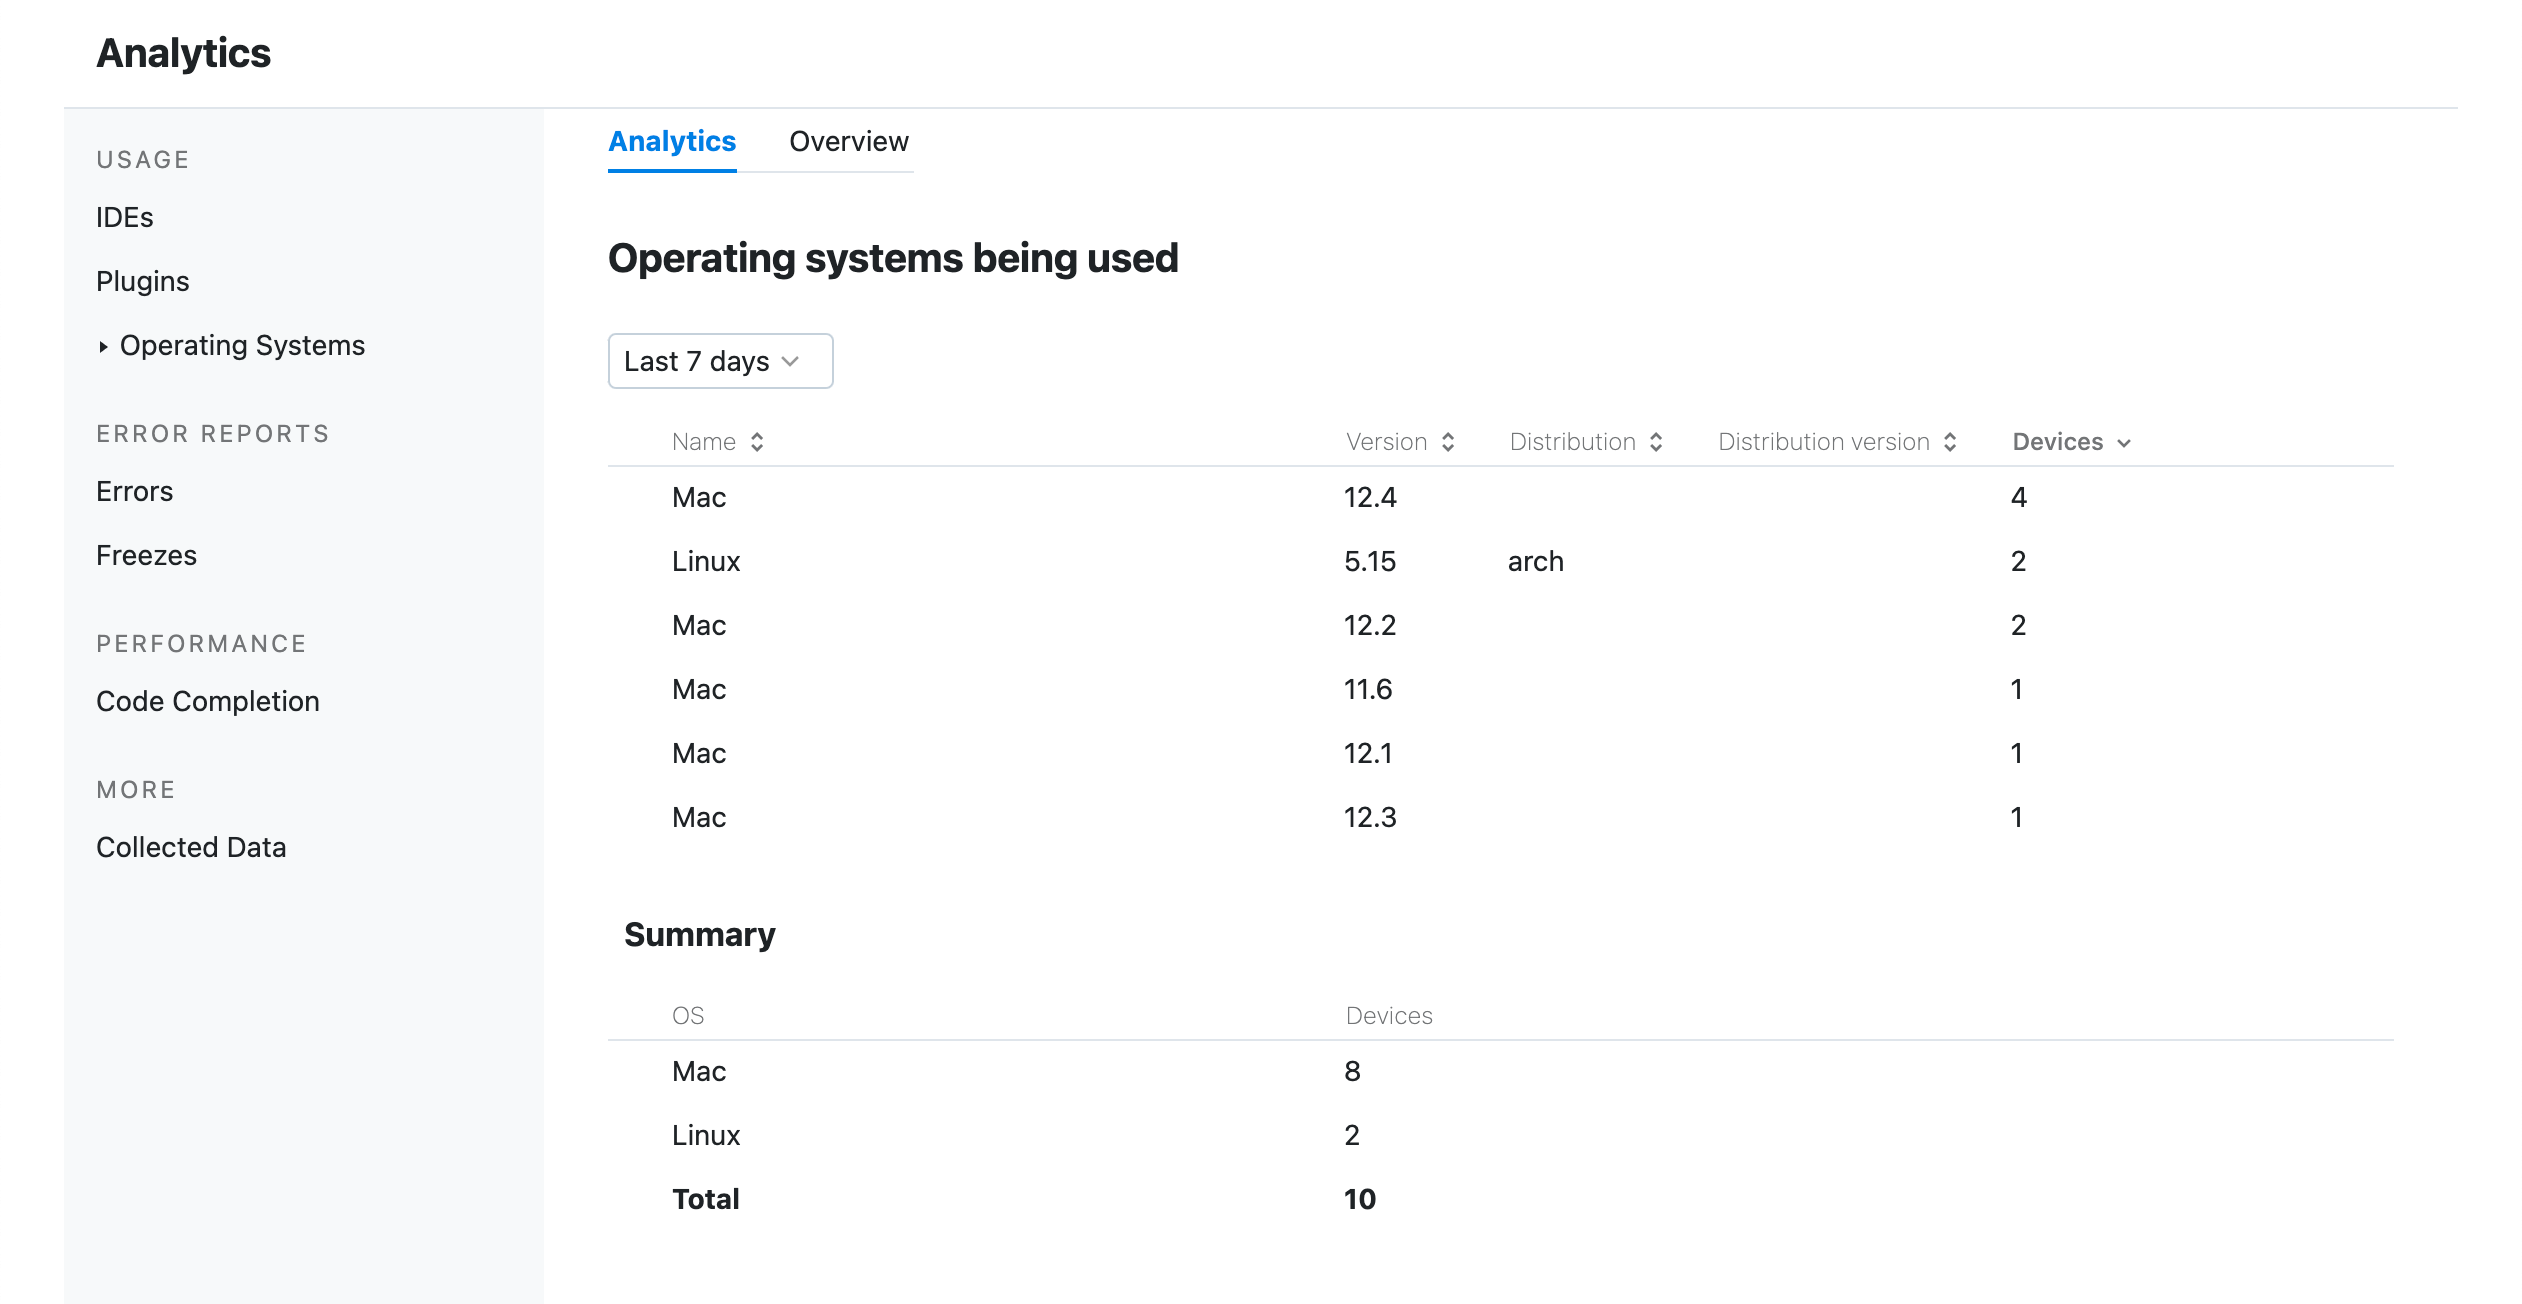
OS types and versions
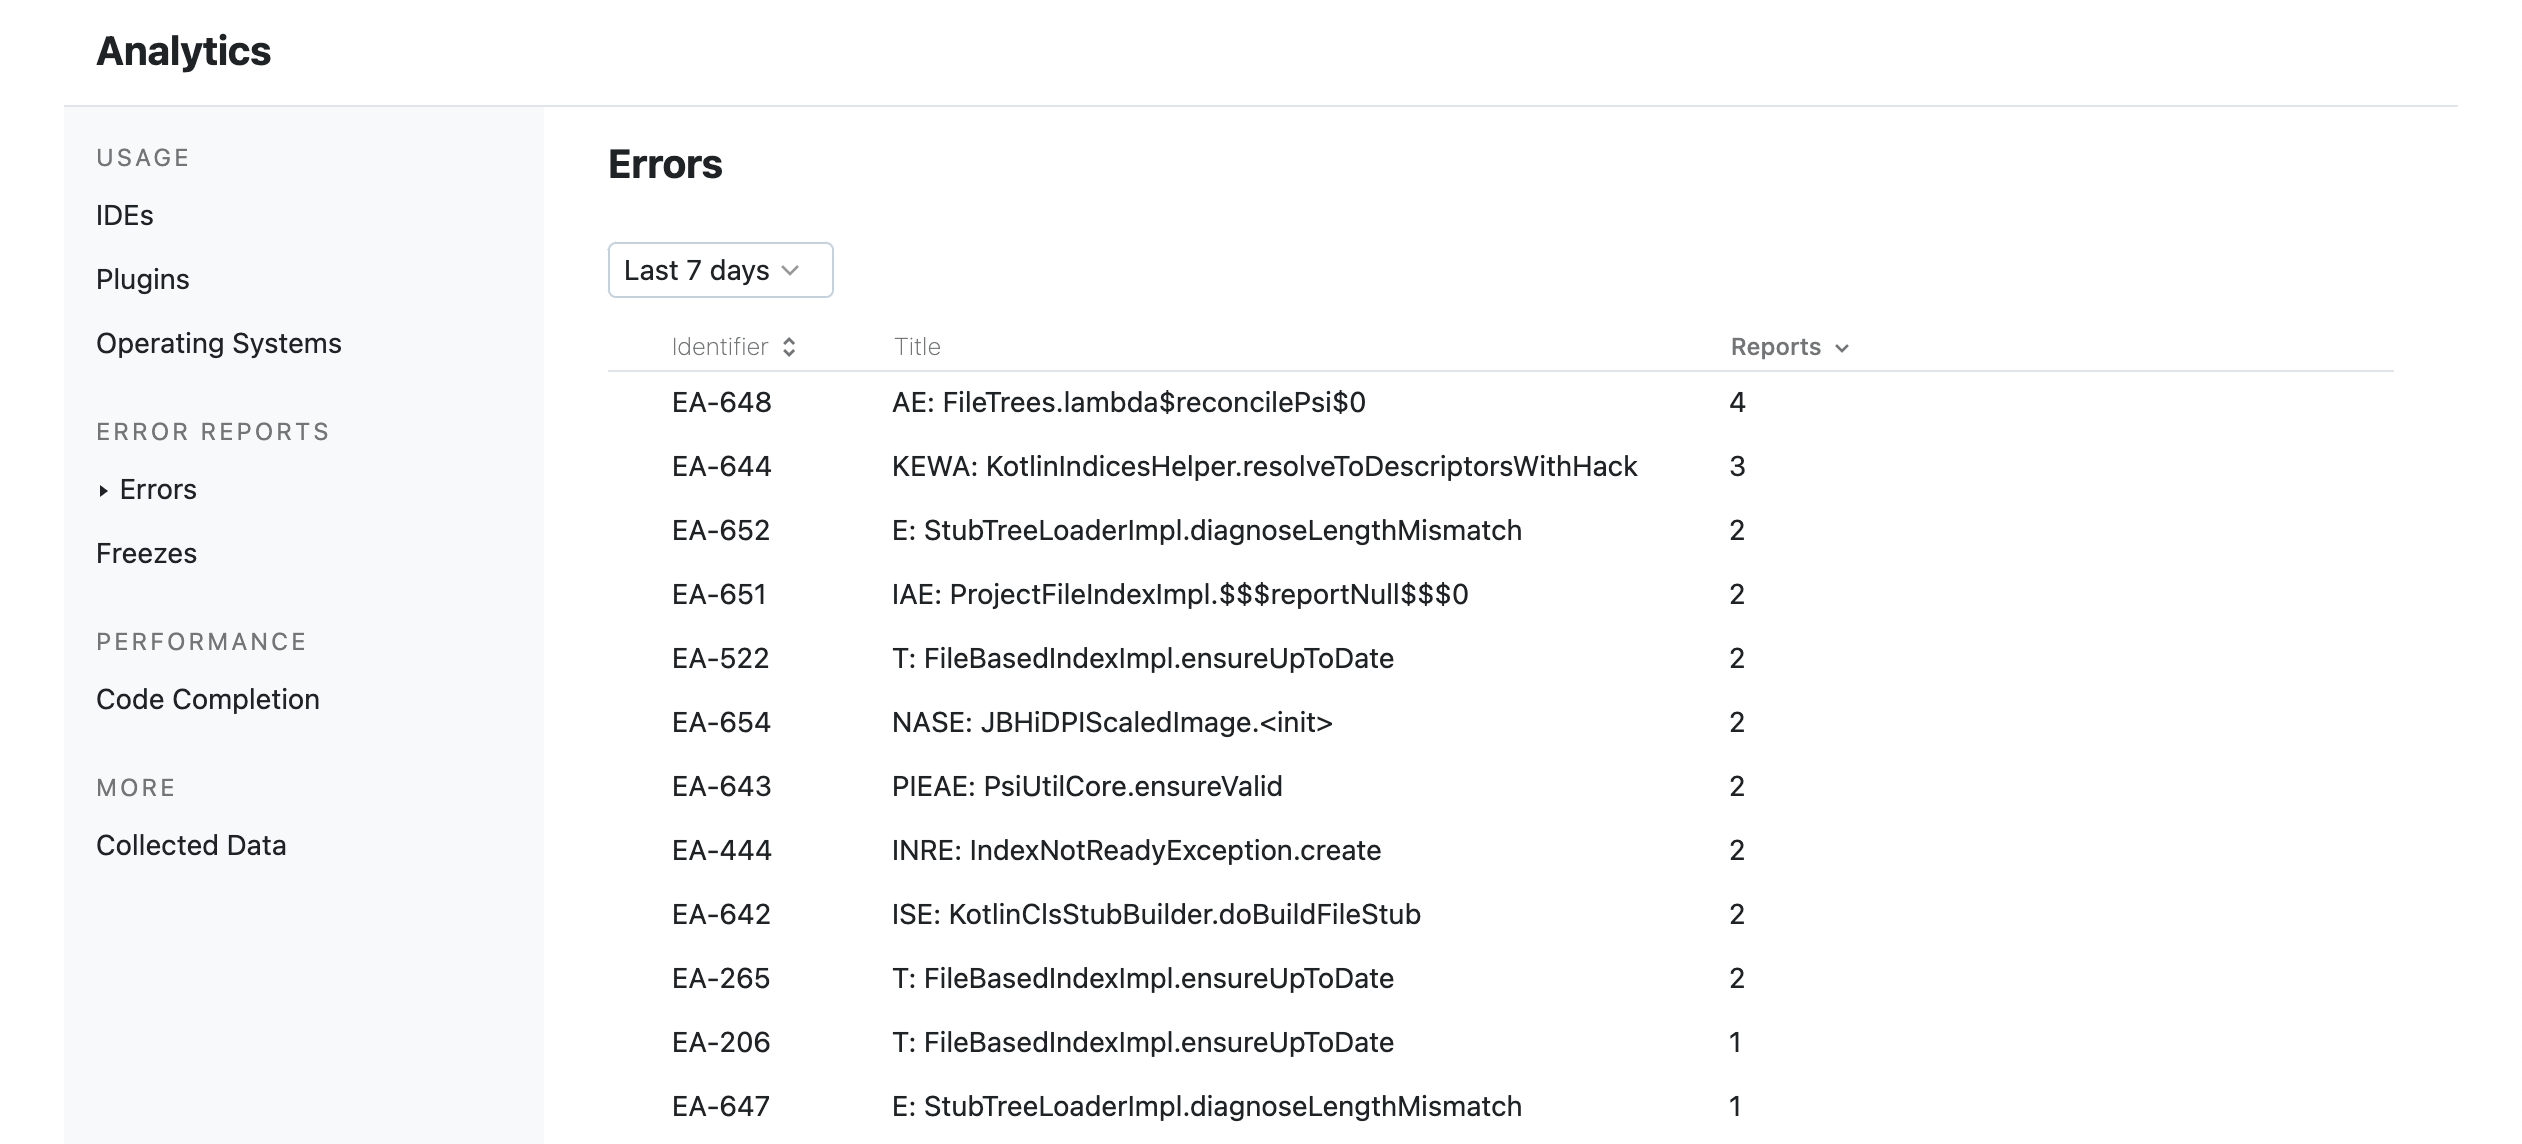
Recent IDE errors (exceptions)
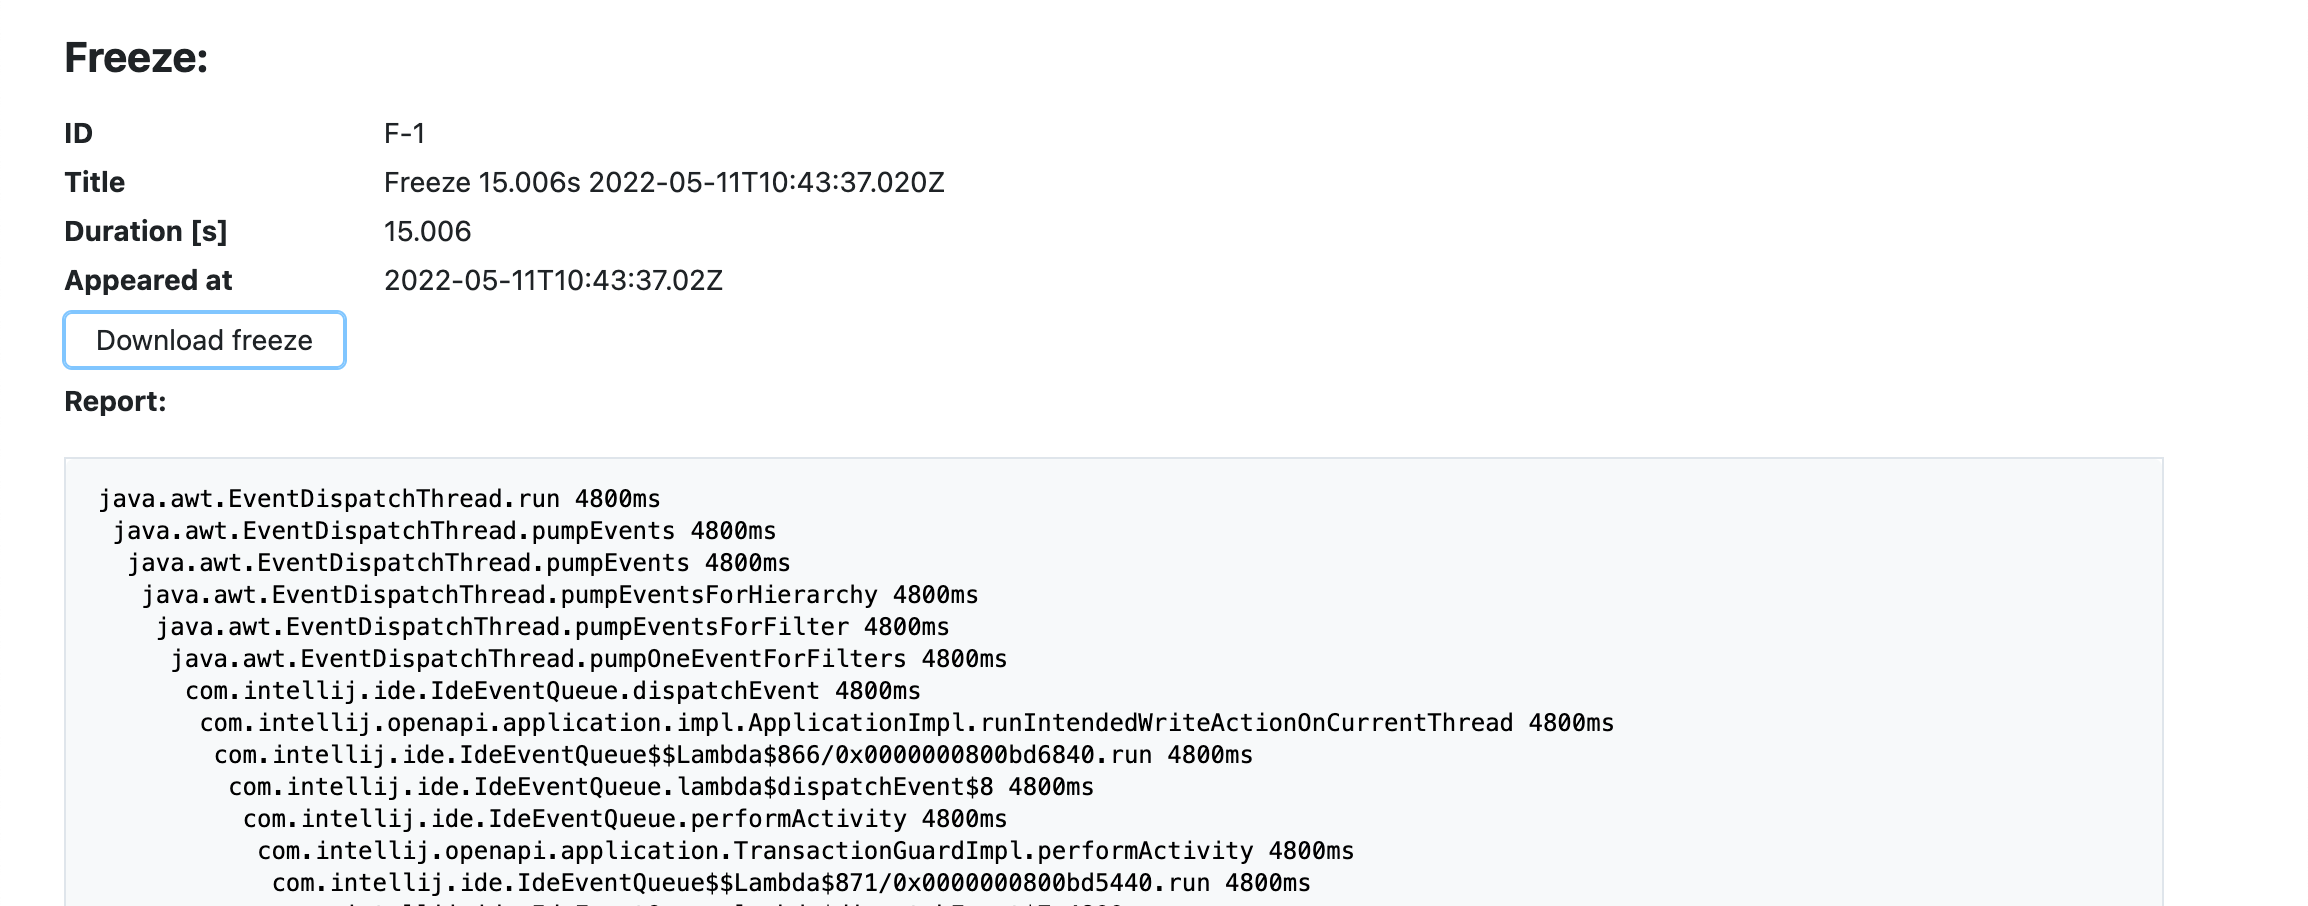
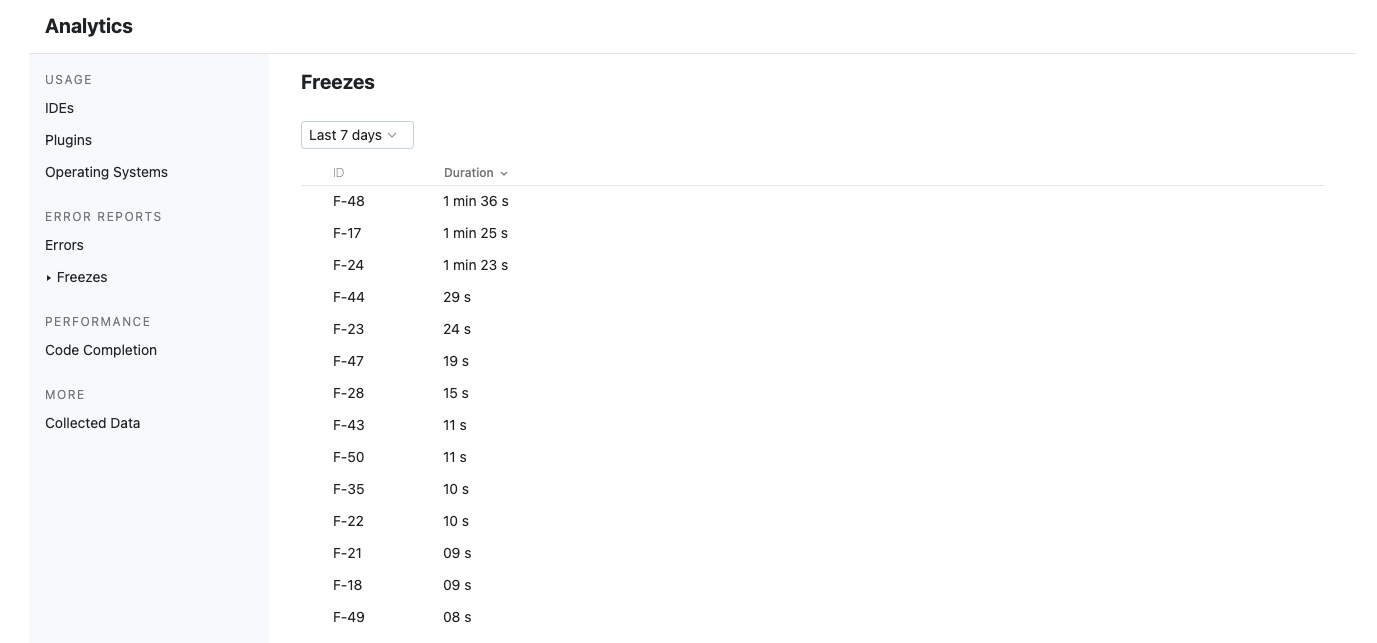
Recent freezes
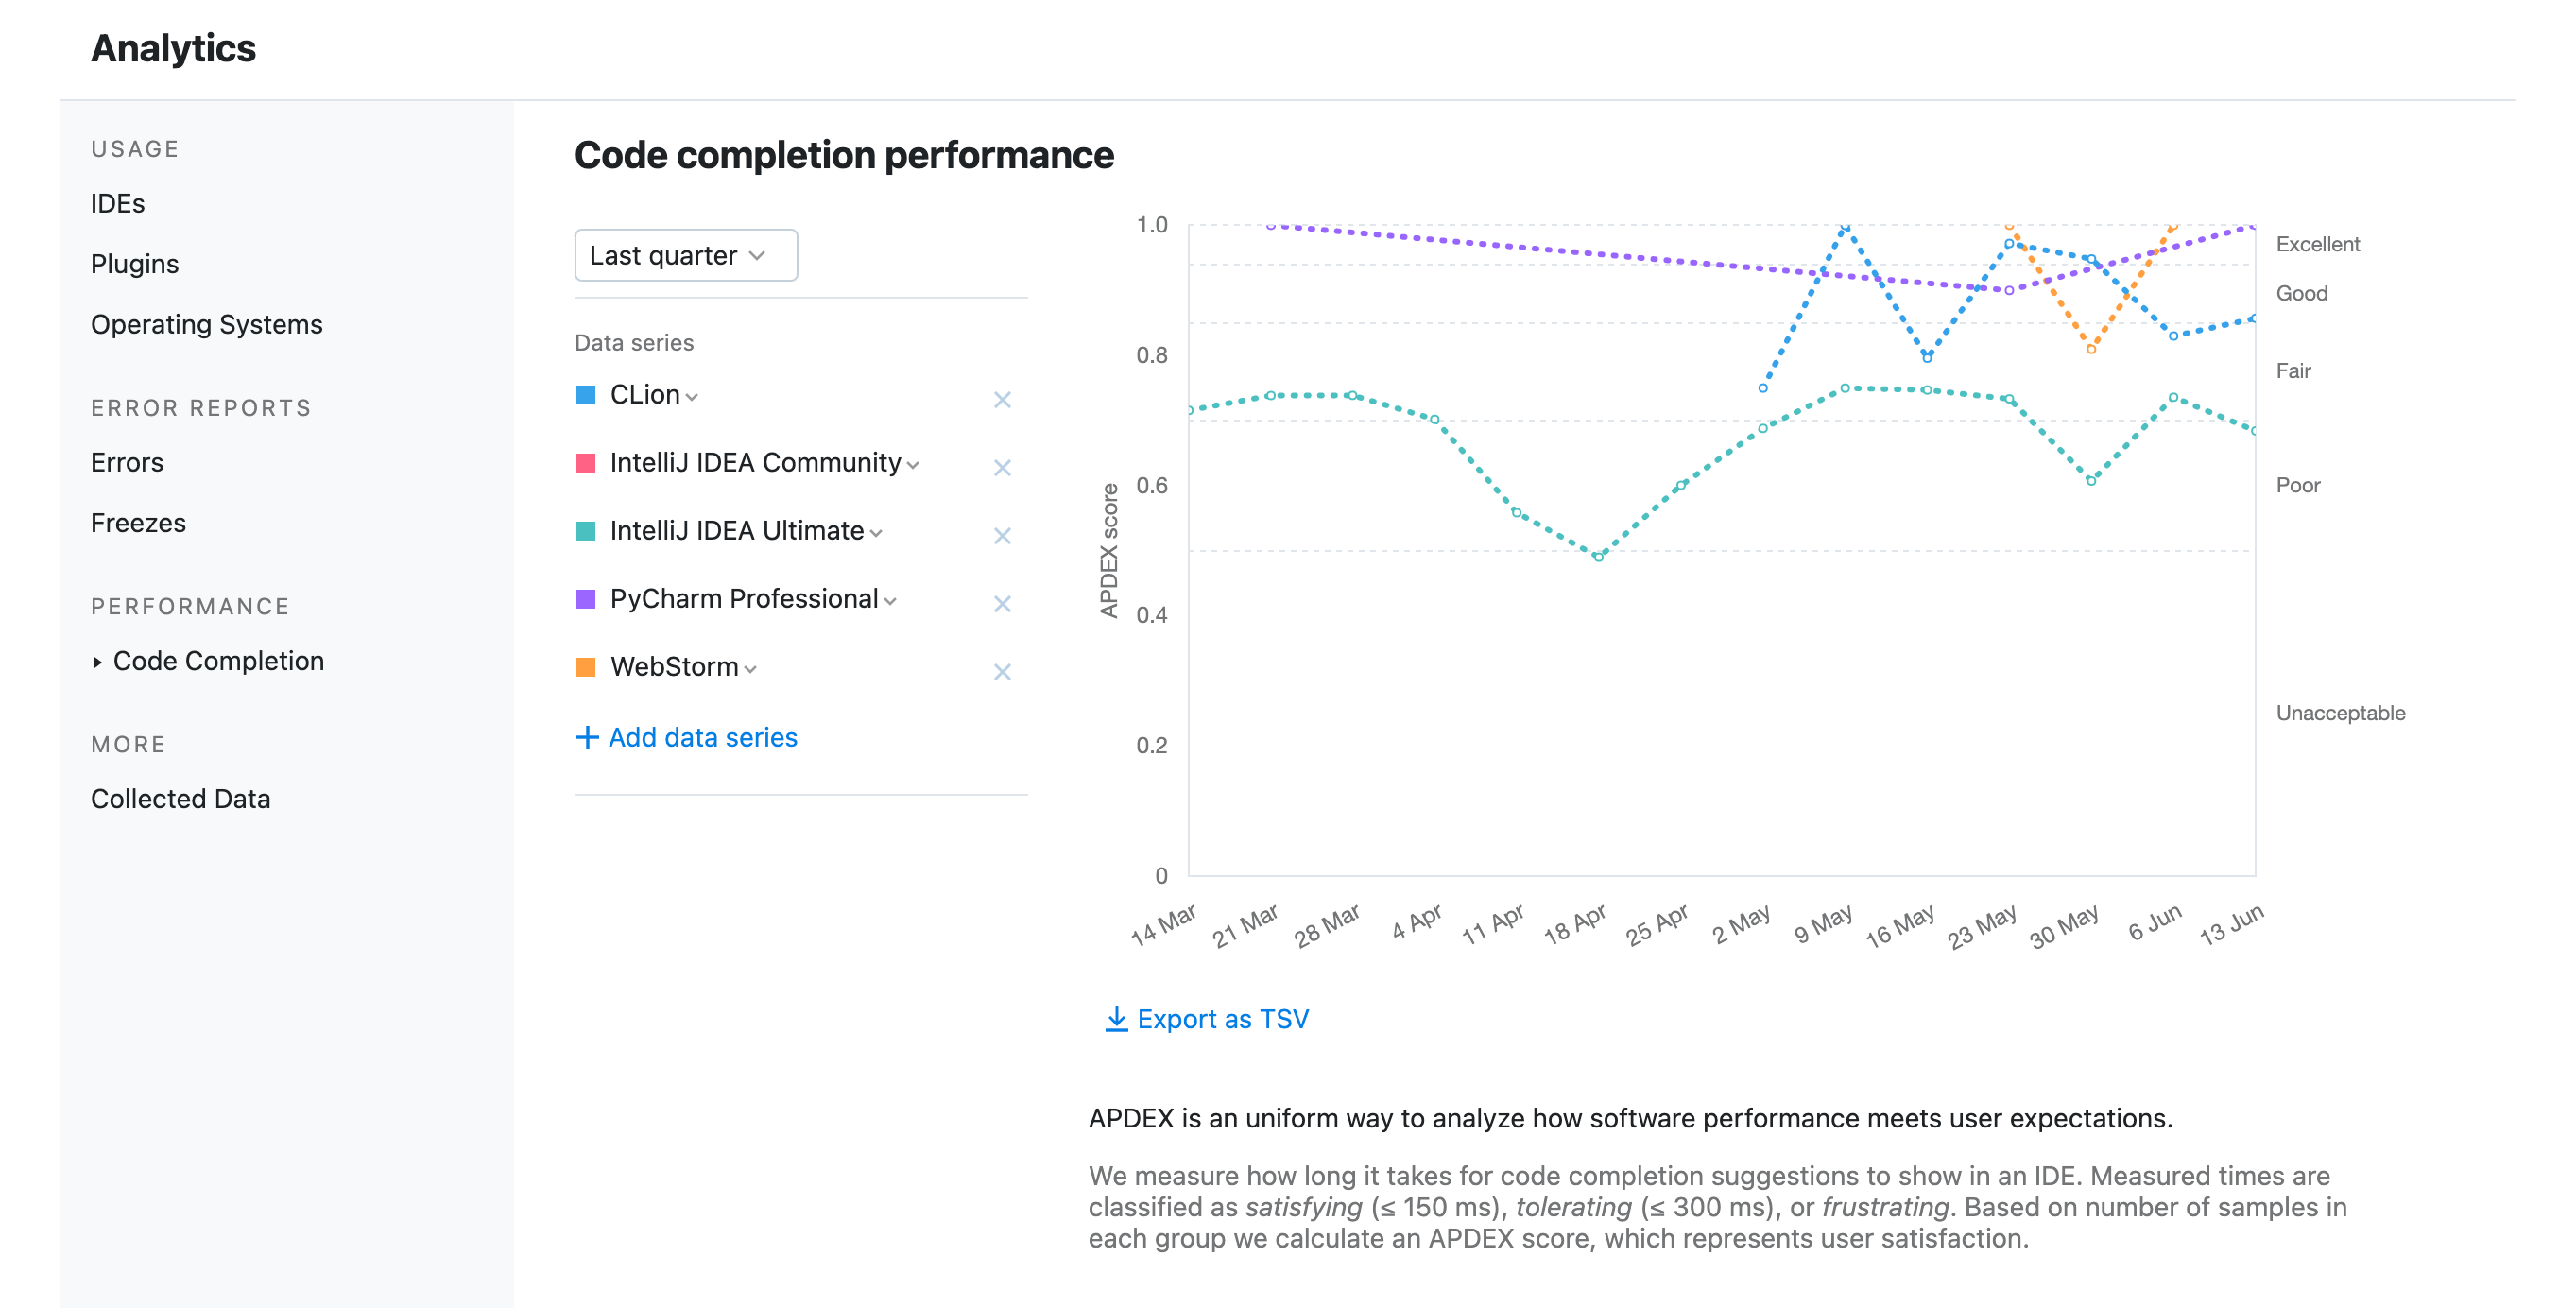
Code Completion performance APDEX metrics
View error details
Go to the Analytics page and select the Errors tab on the left-side pane.

Double-click the row with a particular error to see the report in details.
Similar error reports are grouped together. You can check the number of times the error occurred in the Reports column.
In the opened page, you can get acquainted with error details, download a stacktrace and zip-archive with the metadata. You can use these details, for example, to report an issue to JetBrains or to resolve the problems within your own plugin.

View freeze details
Go to the Analytics page and select the Freezes tab on the left-side pane.

Double-click the row with a particular freeze to view its details.
In the opened page, you can check the freeze details, including its duration, timestamp, and the report itself.
Click Download freeze to download a zip-archive containing the related metadata and freeze details.
