Pro tips
This guide targets IntelliJ IDEA users who are already familiar with its basic features and would like to learn more. If you’re relatively new to IntelliJ IDEA, we recommend that you read the IntelliJ IDEA overview before delving into this one.
Coding assistance
Full Line code completion
The Full Line code completion feature uses a locally run deep learning model to suggest entire lines of code.
To accept an entire suggestion, press Tab.
Alternatively, go to in the main menu or configure a different shortcut.
To accept a suggestion word by word, press Ctrl+Right or go to in the main menu.
To accept a suggestion line by line, press End or go to in the main menu.
Type Info and Quick Documentation
If you want more information about a symbol at caret, for example, where it comes from or what its type is, the Quick Documentation is your friend. Press Ctrl+Q to invoke it, and you will see a popup with these details.
If you don’t need the full info, then use the Type Info action instead: place the caret at a code element and press Ctrl+Shift+P or go to in the main menu. It only shows the type of the selected expression but doesn't take up that much of screen space.

Code completion case sensitivity
By default, IntelliJ IDEA code completion case sensitivity only affects the first letter you type. This strategy can be changed in the Settings dialog (Ctrl+Alt+S) on the page, where you can make the IDE sensitive to all letters.

Here, you can also turn off the Show suggestions as you type option. This makes sense if you want the code completion popup to show up only when you explicitly call it.
CamelHumps
By default, when you select anything in the editor, IntelliJ IDEA isn’t sensitive to the case of the words. If you prefer to select words according to CamelCase, for example, instead of selecting the whole word, select a part of it. You can enable this in of the Settings dialog.
Refactorings
Extract string fragments
IntelliJ IDEA is capable of refactoring not only executable code, but also string literals. Select any fragment of a string, call Extract variable/constant/field/parameter to extract it as a constant and replace its usages throughout the code.
Type migration
When you refactor, you usually rename symbols or extract and move statements in the code. However, there’s more to refactoring than just that. For example, Type migration (available via Ctrl+Shift+F6) lets you change the type for a variable, field, parameter or a method’s return value (int → String, int → Long, etc), update the dependent code, and resolve possible conflicts.
Invert boolean
If IntelliJ IDEA can automate type migration, why not do the same with semantics? To invert all usages of a boolean symbol, use the Invert Boolean refactoring.
Undo refactorings
With IntelliJ IDEA you don’t need to worry about consequences when refactoring code, because you can always undo anything by invoking Undo via the convenient Ctrl+Z shortcut.
Code analysis
Structural search and replace
Structural Search and Replace, or SSR, is quite powerful (after you learn to use it right), and can be used for static code analysis and refactoring automation. In a nutshell, it lets you search for specific patterns in your code and replace them with parametrized templates. For that, it’s equipped with its own language for defining code patterns that is described in more detail in this article.
To access this feature, use the . If you want to create your templates or patterns, go to the Settings dialog, click the page Editor | Inspections, and enable Structural Search Inspection under the General node:

User interface
Disable breadcrumbs and tag tree highlighting
If you work with lots of HTML and XML and would like to avoid unnecessary distraction, you may want to disable breadcrumbs and tag tree highlighting in .
Disable unnecessary gutter icons
Gutter, the leftmost editor column, typically displays useful information related to the code you’re editing. If you feel that sometimes it’s just too much, you can configure what you want to see in the Settings dialog (Ctrl+Alt+S) : Editor | General | Gutter Icons.
Search everywhere
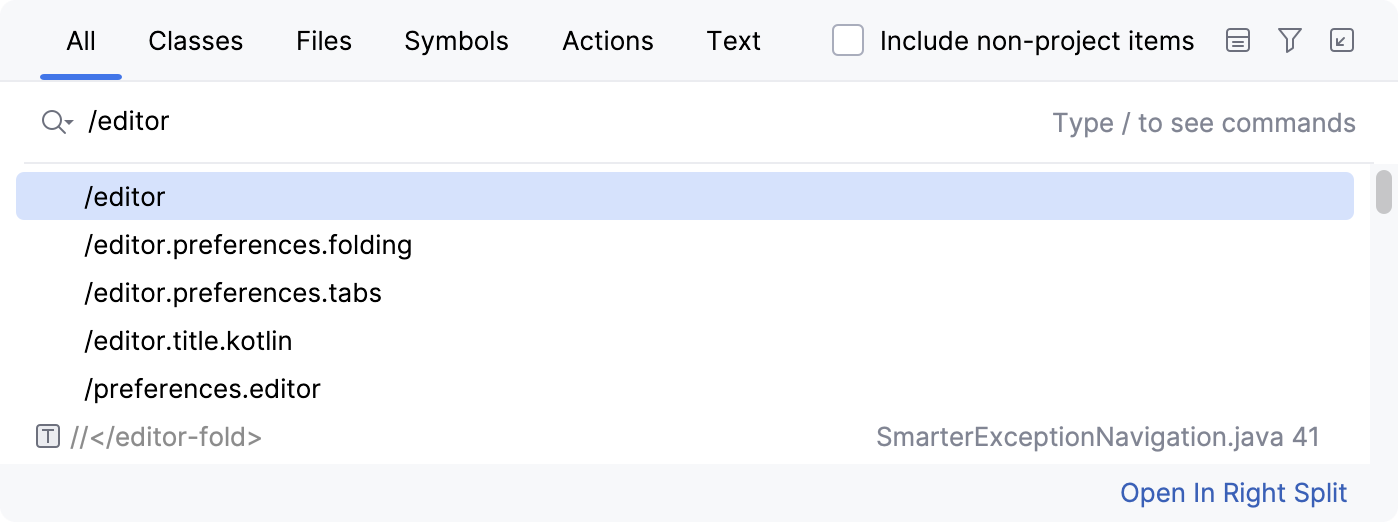
With Search Everywhere you can find arbitrary text fragments literally everywhere: in your code, libraries, parts of the UI, settings (by prepending the settings name with /), or even action names. If you’re using this feature a lot, it’s worth knowing that you can access IntelliJ IDEA settings by just pressing Enter right in its popup. For example, here we're accessing the editor settings:

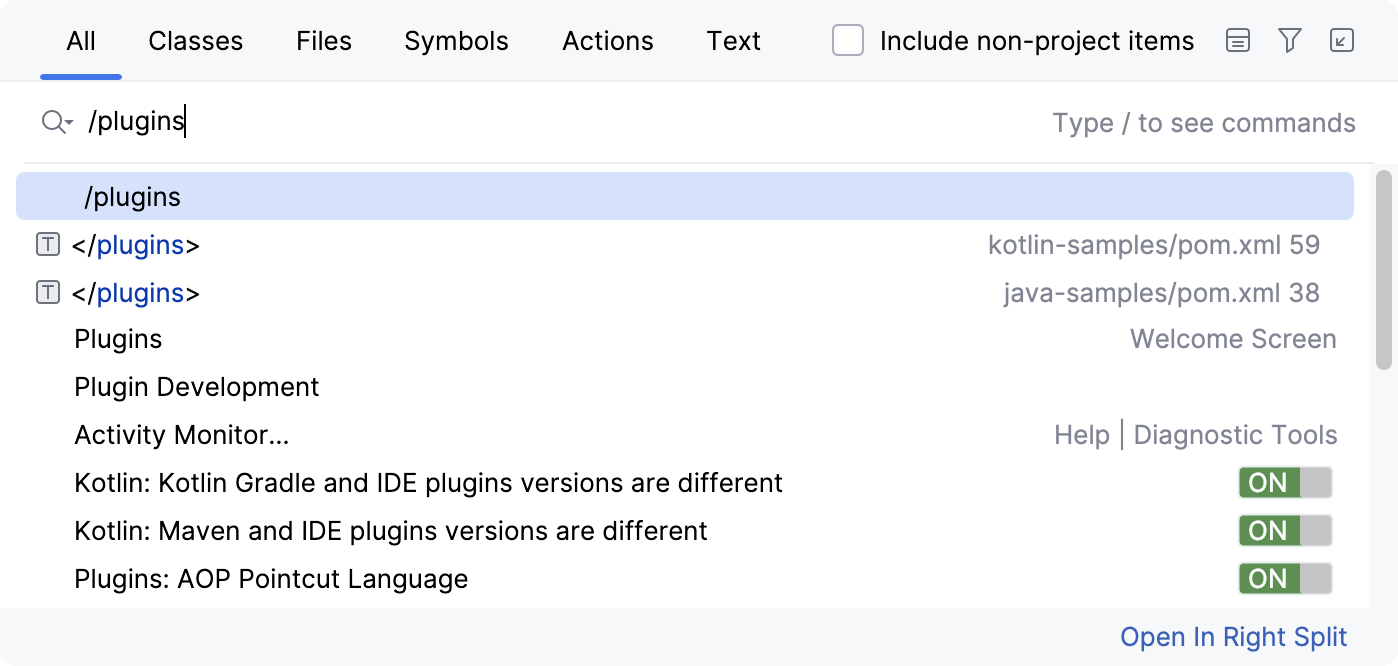
If you start your search query with /plugins, you’ll be able to turn them on and off:

Other tags include /appearance, /system, /inspections, /registry, /intentions, /templates, and /vcs.
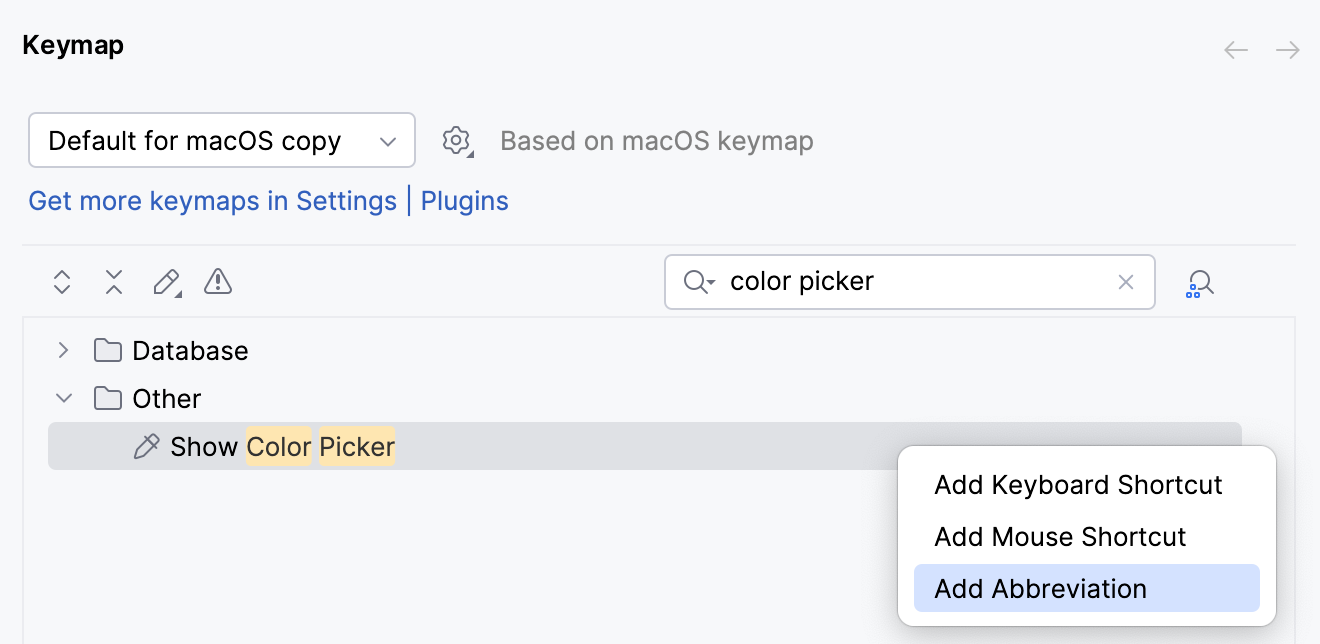
Another interesting fact is that Search Everywhere supports abbreviations. You can use Keymap page of the Settings dialog to assign a short text to any action,

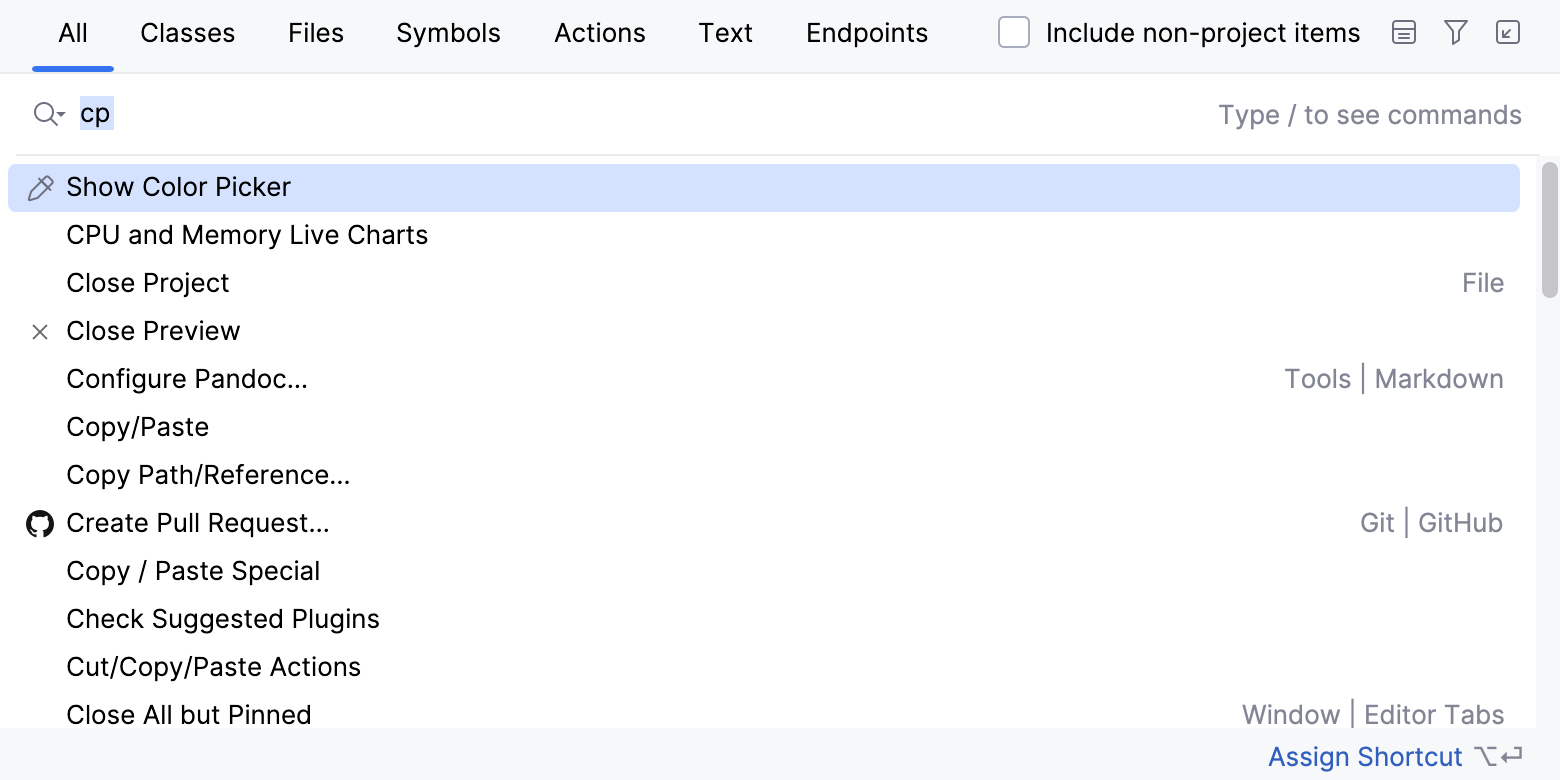
and then have this action called from Search Everywhere by entering this text:

Hide editor tabs
When you need to close all editor tabs except the current one, click the close icon on the current tab holding Alt.

If you don’t want to see the editor tabs at all, go to the Editor Tabs page in settings and from the Tab placement drop-down list, select None.
Open a file in a new window
A feature that is not that easy to find, yet comes in handy, is opening a file in a new window by selecting it in the Project tool window and pressing Shift+Enter.
Editor
Compare with clipboard
IntelliJ IDEA has a built-in diff viewer for code, jar files, revisions, and even images. To invoke it, select any pair of files and press Ctrl+D.
If you have selected a single file, the IDE will prompt you to select the one to compare to. To quickly compare the active editor with the Clipboard, choose .

Paste from history
IntelliJ IDEA keeps track of everything you copy onto your Clipboard. Anytime you want to paste one of the previously copied items from your Clipboard history, press Ctrl+Shift+V.

Multiple selections
Multiple selection lets you quickly select and edit multiple pieces of text at once.
First, select the text range you want to edit.
Then, press Alt+J and IntelliJ IDEA will search the current file forward until it finds a case-sensitively matching piece of text, which it adds to the selection. You can press Alt+J again to go forward, or Alt+Shift+J to go back, but note that when search reaches the end of file, it will start over from the beginning of the file.
After the selection is complete, you can start editing all the fragments as if they were one.

Regex
IntelliJ IDEA offers various features to help you work with regular expressions (regex or regexp). For example, you can use regex with the Find and Replace feature which also supports captured groups in replacement expressions. Or you can check any regex in your code: just place the caret at it and press Alt+Enter to use the Check Regex intention.

Version control
Amend changes
In the Commit Changes dialog IntelliJ IDEA offers to perform a variety of operations. One of them is Amend commit, which is useful when you want to change your last commit and join your current change to it.
Shelves and patches
Shelves is an IDE feature similar to Git Stash, but that works for all VCS: it helps when you need to pause your current work and pull something from the repository to fix it asap, and then resume working on whatever it was you were working on. This feature takes care of locally changed files without committing them, so no more lost changes or hastily made merge commits.
For more information, refer to the page Git-Stash and to the section Stashing and Unstashing.
Patches allow you to save a set of changes to a text file that can be transferred via email (or any other ancient medium), and then applied to the code. It’s helpful when you really need to commit something after your plane landed on a desert island, or you somehow else got yourself in a situation without reliable broadband connection.
For more information, refer to Using Patches.
Debugging
Non-suspending breakpoints
Sometimes you may want to evaluate something at a particular line of code without suspending the program. You can do that by using a non-suspending breakpoint. To create one, just click the gutter holding Shift and enter the expression in the Evaluate and log field.

This way you can change or log the application state without inserting additional statements in the project code. This is especially useful when you debug compiled classes, which you cannot change.
Field breakpoints or field watchpoints
In addition to the action breakpoints mentioned above, you can also use Field watchpoints. This breakpoint will stop execution when a field associated with it is accessed. To create field watchpoints, just click the gutter holding Alt (Ctrl+Cmd for macOS).

Object markers
When you’re debugging an application, IntelliJ IDEA lets you mark particular instances of arbitrary objects with colored labels for easier identification via the Mark Object action (available in the Evaluate Expression, , Variables or Watches views. )
And if you have any instance marked with a label, you can use it in the condition expression as well:

Custom data renderers
Evaluate Expression, Variables, Watches and inline debugger all use a standard way to render variable values, mostly based on toString implementation of classes. Not everyone knows that you can define your own custom renderers for any class. For that, select from the context menu in the Debug tool window tool window.

This is especially useful when some of the classes in the libraries you’re using do not provide a meaningful a toString implementation–so you can define it yourself outside of the library.
Drop frame
In case you want to “go back in time” while debugging you can do it via the Drop Frame action. This is a great help if you mistakenly stepped too far. This will not revert the global state of your application but at least will get you back by stack of frames.
Force return
The way around, if you want to jump to the future, and force the return from the current method without executing any more instructions from it, use the Force Return action (to invoke it, press Ctrl+Shift+A and type the action name). If the method returns a value, you’ll have to specify it.
Language Injection
Language injections allow the IDE to recognize pieces of code embedded into string literals. When you inject a language into a string literal, you get comprehensive code assistance for editing that literal, such as syntax highlighting and code completion.
For example, in Java code, you can inject JSON into a string literal. IntelliJ IDEA recognizes the injected JSON code and provides JSON-specific features such as syntax highlighting and code formatting within the injected fragment, making it easier to work with both languages in the same file.
For more information, see Language Injection.

Update application
If you are running your application on an application server (Tomcat, JBoss, and so on), can you reload changed classes and resources using the Update application action via Ctrl+F10.
For more information, refer to Update applications on application servers.
Tools
External tools
IntelliJ IDEA has many developer tools integrated and working out of the box. If a tool you need is not integrated, but you’d like to use it via a shortcut, go to External Tools, and configure how to run this tool. Then you’ll be able to run this tool via the main menu.
For more information, refer to External tools.