Icon reference
Many entities in IntelliJ IDEA are marked with icons: there are icons on toolbar buttons, in the gutter, in the Project tool window, and so on. The majority of icons have tooltips that allow you to quickly grasp their meaning. Hover the mouse over an icon and wait for the tooltip with some brief information.
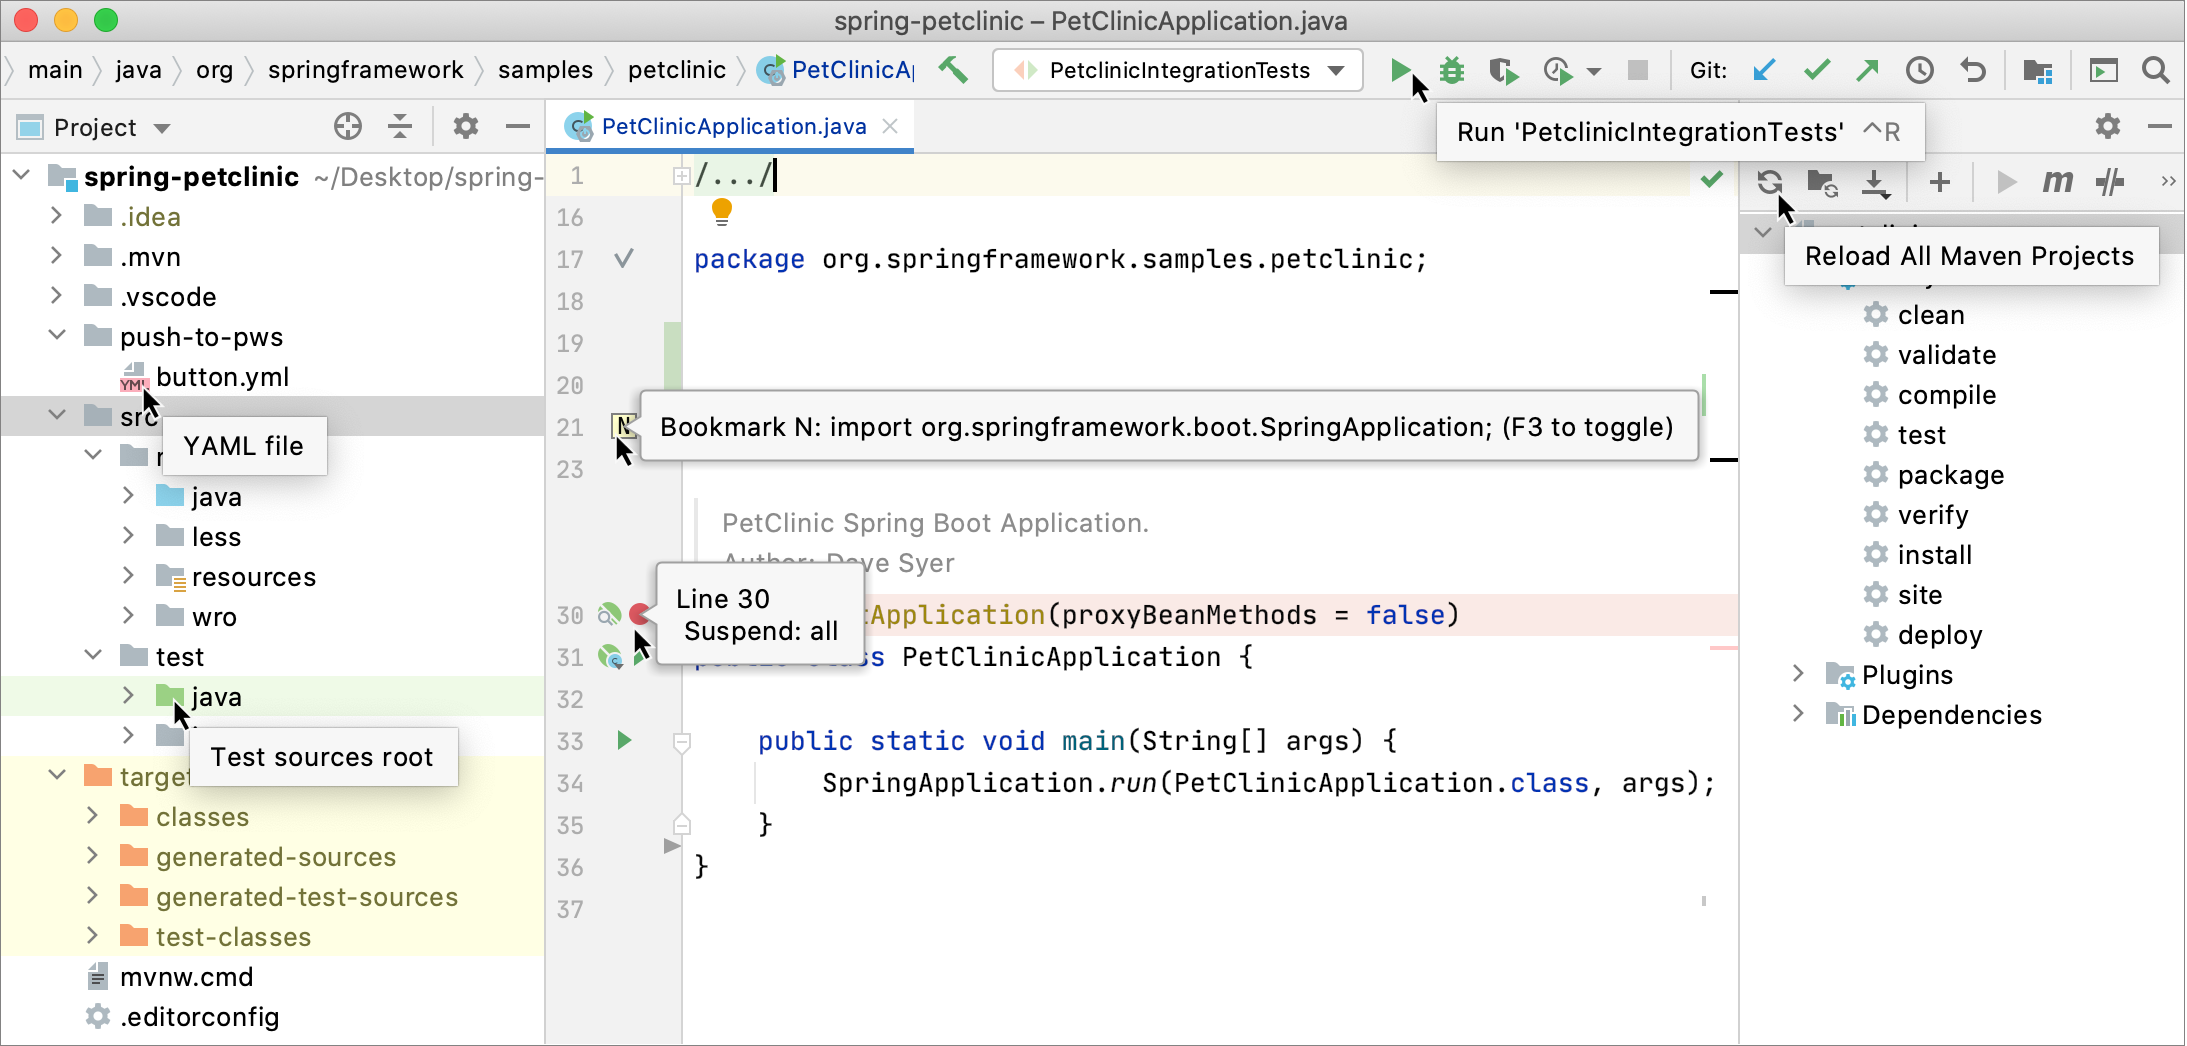
Project items
Project items (classes, methods, fields, folders, content roots, and so on) have tooltips that provide basic information about them. If you want to learn more about an item in the Project (Alt+1) or any other tool window, hover the mouse pointer over its icon.

Gutter icons
Gutter icons are located in the editor on the left. Every icon in the gutter has a tooltip that explains its meaning and provides additional actions. For example, you can navigate to the related element, run a test or a method, and so on.
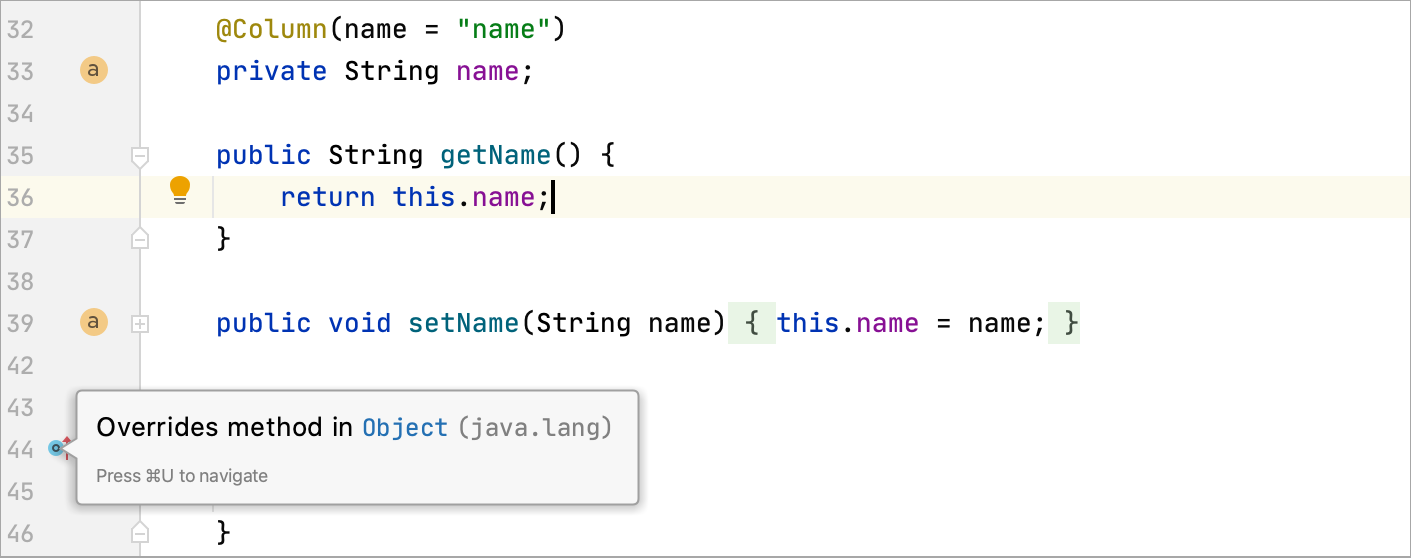
The list of available gutter icons depends on the configuration of your project, the frameworks that you use, and the plugins that you have installed. To access the list of gutter icons available for your project, go to .
For more information on gutter icons, refer to Gutter Icons.
Breakpoints
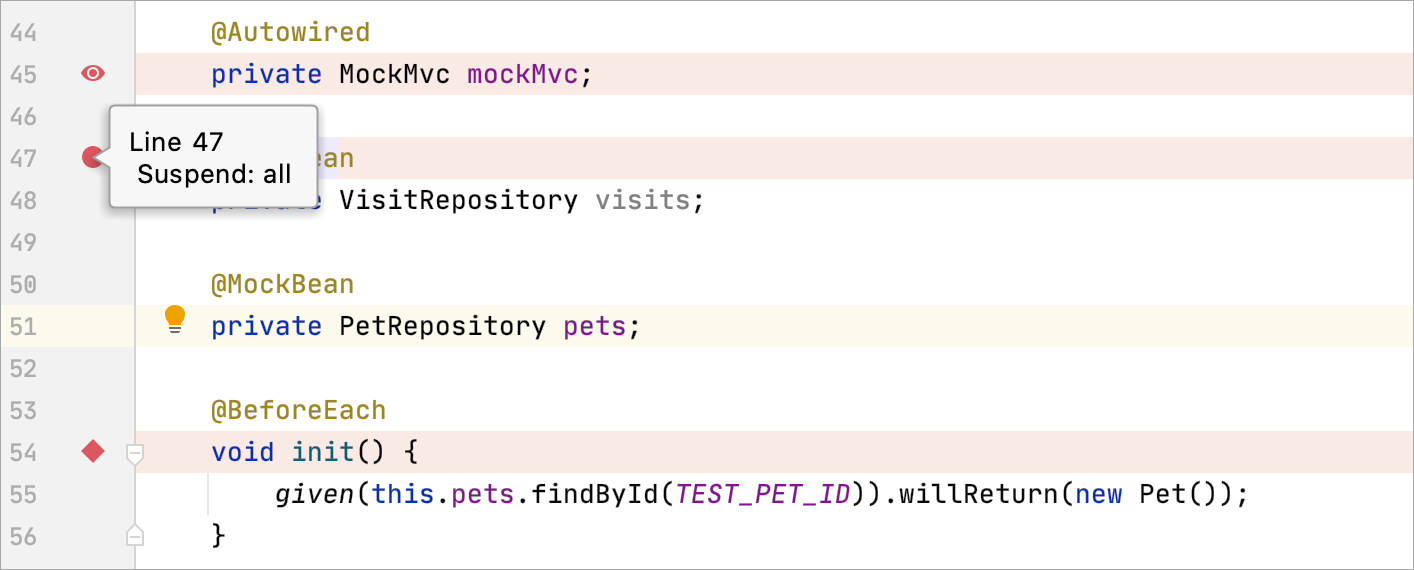
Breakpoints are special markers that suspend program execution at a specific point. This lets you examine the program state and behavior.
Depending on their type and status, breakpoints are marked with different icons in the gutter. For the full list of icons, refer to Breakpoint icons.
Bookmarks
If you want to return to some place in your code later, you can mark any code line with a bookmark.
There are two types of bookmarks: anonymous bookmarks ![]() and bookmarks with mnemonics (lettered
and bookmarks with mnemonics (lettered ![]() and numbered
and numbered ![]() ). For more information on how to work with bookmarks, refer to Use bookmarks for navigation.
). For more information on how to work with bookmarks, refer to Use bookmarks for navigation.

Toolbar icons
IntelliJ IDEA has many tool windows, and almost every tool window has a toolbar with buttons. If you want to know what action a button performs, hover the mouse pointer over it to display a tooltip with the action name.

File status markers (VSC)
If your project is under version control, you can track uncommitted changes in a file by looking at the color indicators in the gutter. New, modified, and deleted lines have special markers by clicking on which you can open a diff, revert the changes, and perform other VCS-related actions. For more information, refer to Track changes to a file in the editor.

Colors in the Project tool window
Some files in the Project tool window have a colored background. For example, tests have a green background by default, and non-project files (for example, compiled files or files excluded from a project) have a yellow background.
You can disable the colored background or configure colors for other groups of files. For more information, refer to Scopes and file colors.
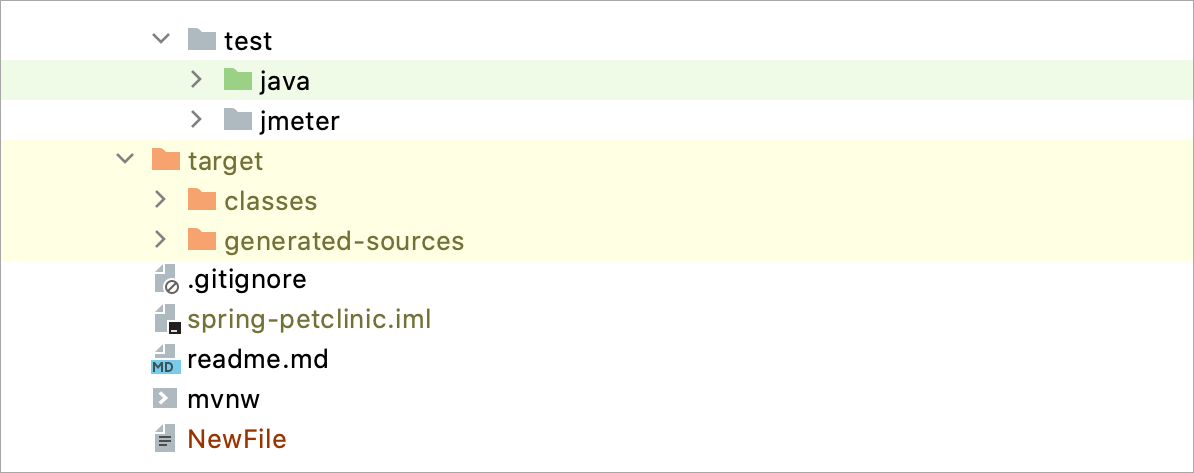
Some files in the Project tool window might be displayed in different colors, for example, in brown or olive. These colors reflect file statuses in your VCS: the brown color is used for new files that are not yet added to the VCS, olive is used for ignored files, and so on. For more information, refer to File Status Highlights.
File type icons
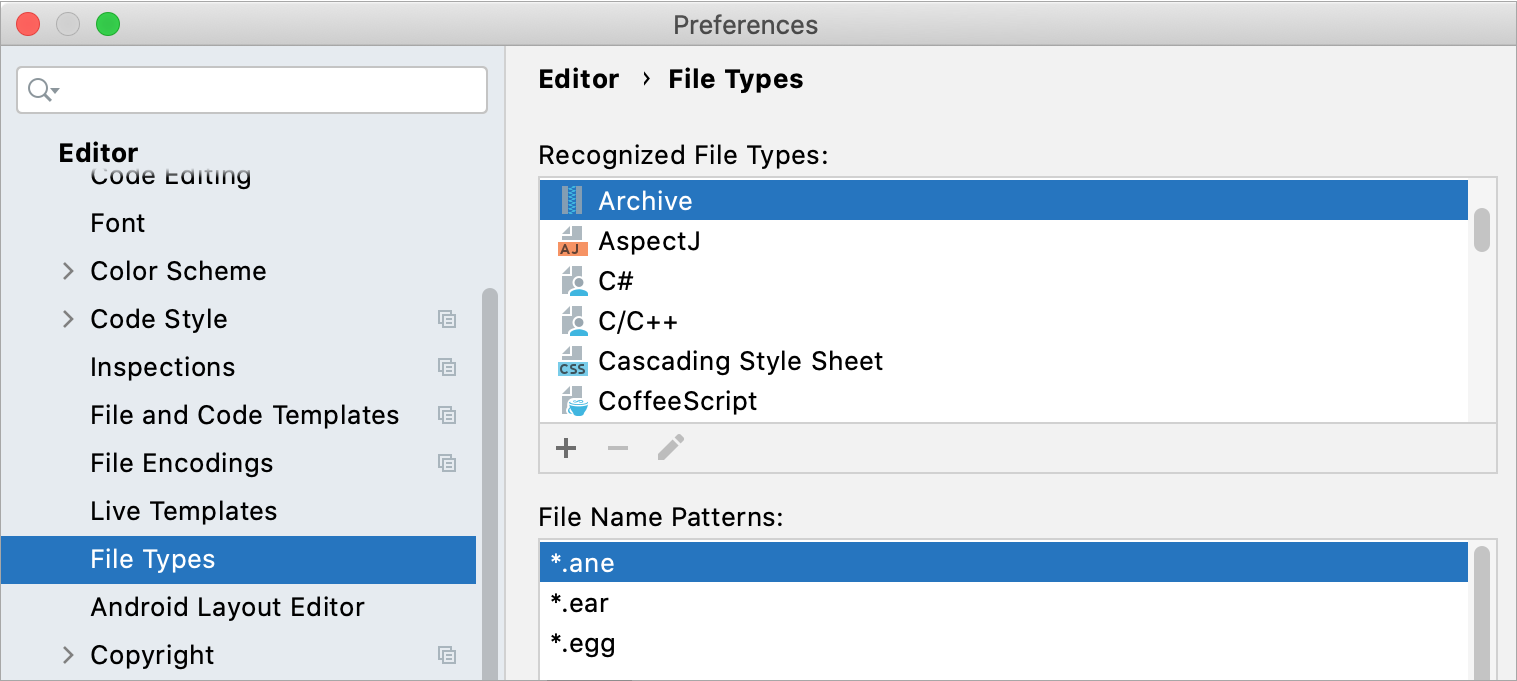
Each file format in IntelliJ IDEA has a dedicated icon. In the Project tool window (Alt+1), these icons help you quickly identify with what kind of files you are working with. To view the list of file types recognized by IntelliJ IDEA and their icons, in the Settings/Preferences dialog Ctrl+Alt+S, go to .
If a file in your project is marked with the icon, it indicates that IntelliJ IDEA can't recognize it. In this case, you can register and configure a new file type.
Code Coverage markers
When you run tests with coverage, the results of the coverage analysis are displayed in the gutter. The IDE highlights the lines of code according to their code coverage status in green, red, or yellow. For more information, refer to Coverage results in the editor.
