Create and open snapshots
This topic explains the steps to create a snapshot. After you have gathered the data, you can analyze the snapshot right away, save for later, or send to someone else.
Prerequisites
You can use the default settings to profile most applications. Unless you are using Linux or want to use a custom profiler, no configuration is required: everything works out-of-the-box.
IntelliJ IDEA profiler supports the following run configurations:
Local process | ||
|---|---|---|
|
| |
|
| |
|
| |
|
| |
|
| |
|
| |
|
| |
|
| |
|
| |
|
|
If the required configuration is not on the list, you are welcome to create or vote for a request in our issue tracker.
Start the profiling session
You can either start an application with the profiler, or attach to an already running application.
Start an app with the profiler
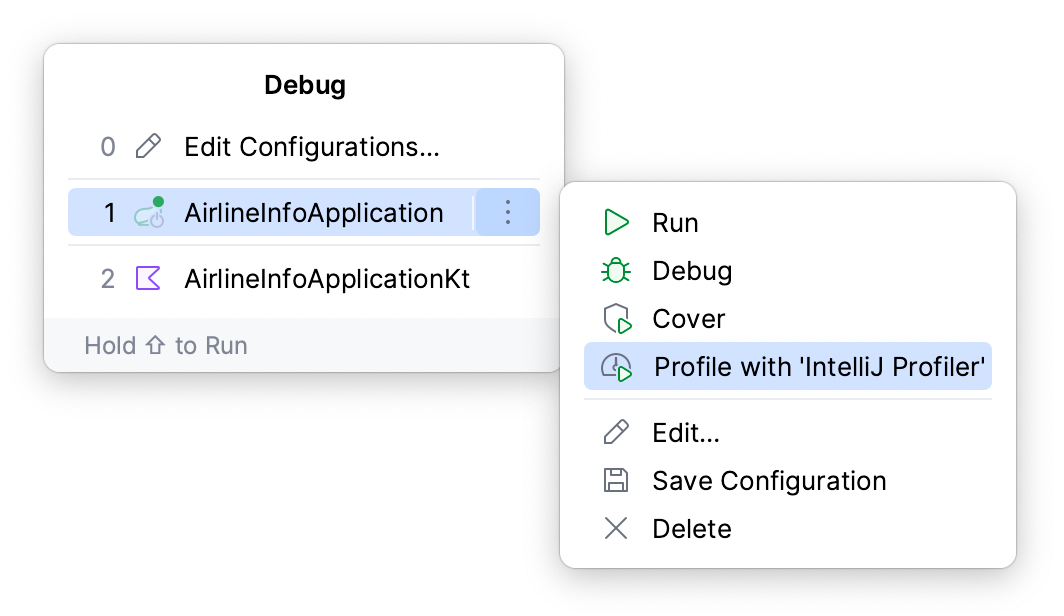
Press Alt+Shift+F10, select the run/debug configuration you want to profile, then select Profile with IntelliJ Profiler from the menu.
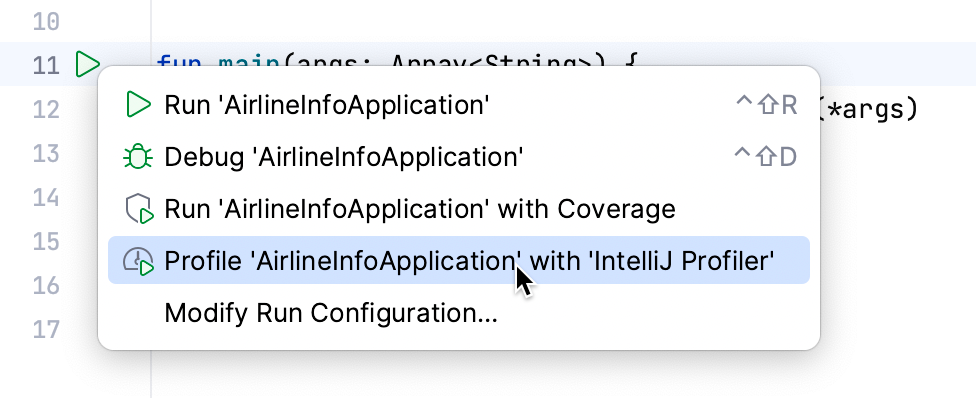
Alternatively, click the Run icon in the gutter. From the menu, select Profile with IntelliJ Profiler.
You can also profile applications that were launched in debug mode. For this, start the debugging session first, then attach the profiler to the running process.
Attach to a launched run configuration
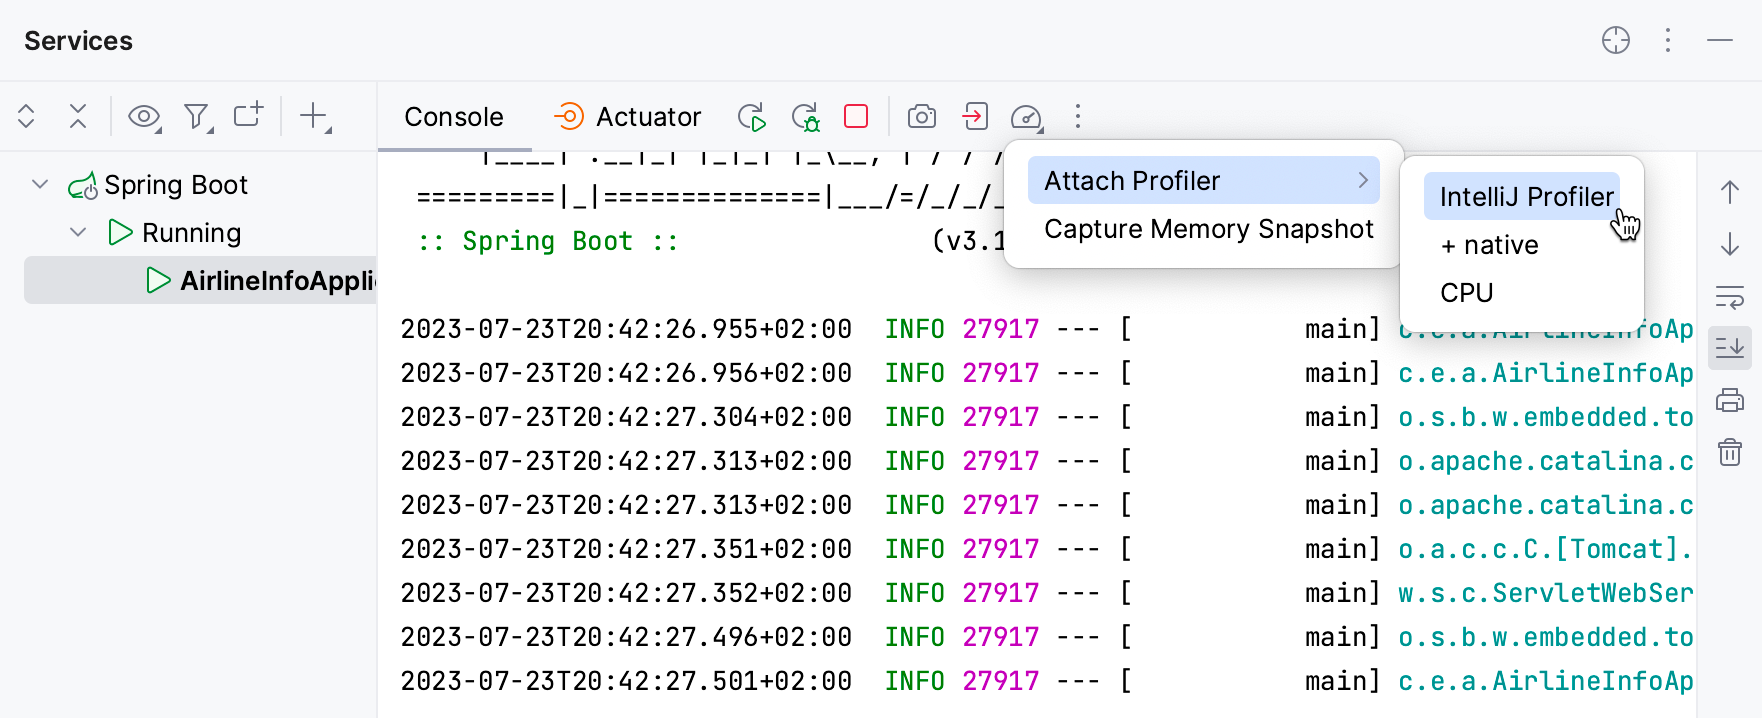
If the process you want to profile is launched through IntelliJ IDEA run configuration, go to the respective tab in the Run or Services tool window, then click .
Attach to an arbitrary process
You can also attach the profiler to an arbitrary Java/Kotlin process running on your system.
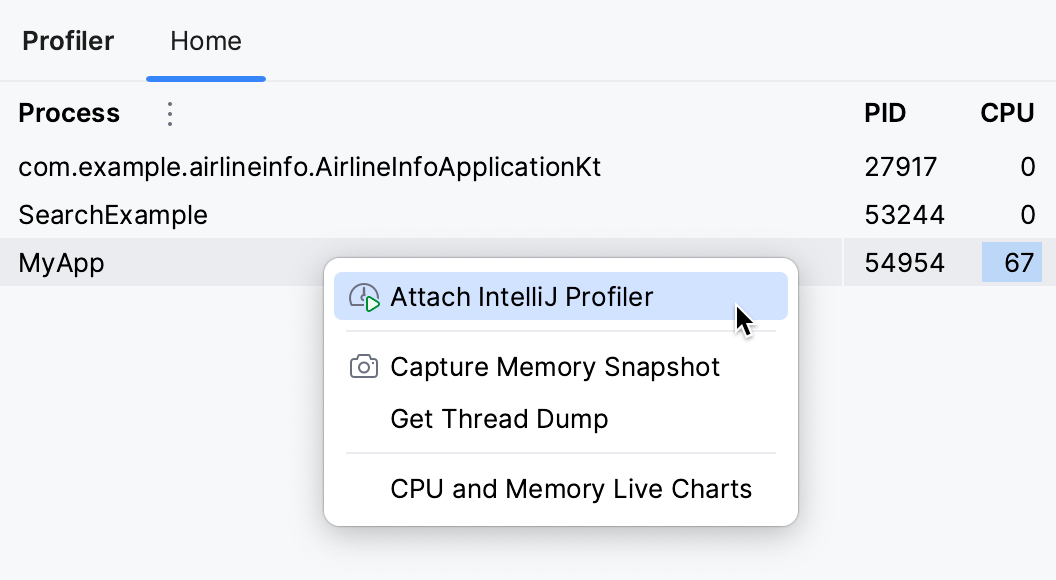
With the process already launched, open the Profiler tool window.
On the Home tab, find the process that you are going to profile. Right-click it, then select Attach IntelliJ Profiler
The profiler will detach and save the snapshot automatically when the process terminates. Otherwise, if you want to leave the process running and only detach the profiler, you can do that manually.
Stop the profiling session
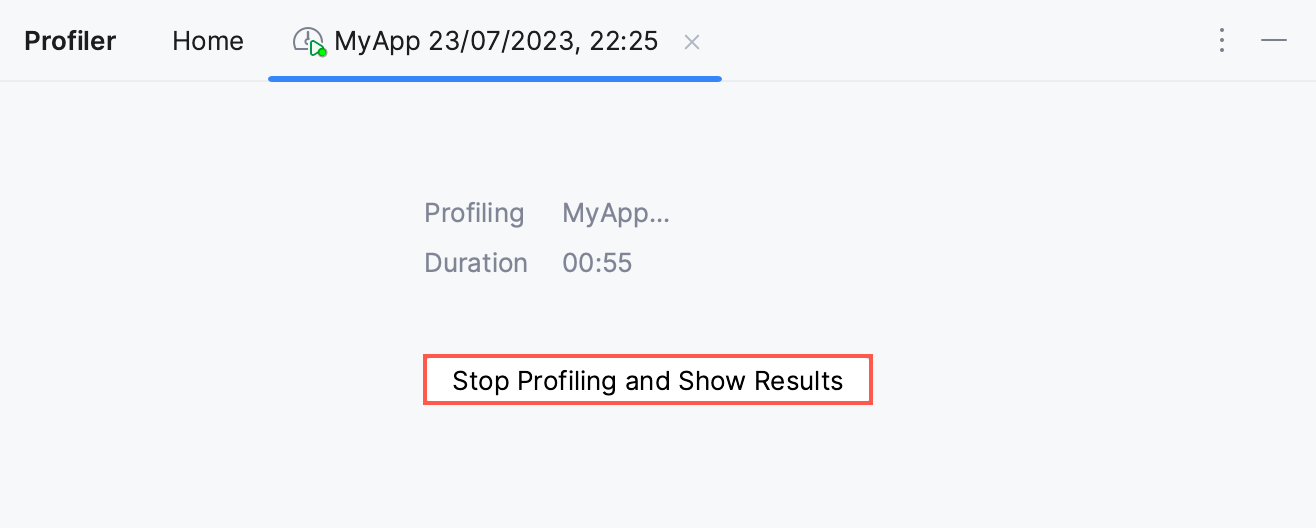
In the Profiler tool window, navigate to the tab that has opened for the process you are profiling and click Stop Profiling and Show Results.
Open snapshots
The snapshot will open right away. Also, if you want to access it later, you can find it on the Home tab of the Profiler tool window. From this tab, you can view the recent snapshots or open snapshots that are stored elsewhere on your hard drive.

By default, the snapshots are stored in the user home directory. If you prefer another location, you can change that.
Change the snapshots location
Open the Profiler tool window.
On the Home tab, click More, then select Change Snapshots' Folder.

Native profiling
By default IntelliJ Profiler only collects Java stack traces, but it can also collect native call data. This is useful for cases when you need to look into JNI calls, garbage collection, JIT compiler operation, and so on.
Include native samples in the snapshot
Press Ctrl+Alt+S to open the IDE settings and then select . Select the Collect native calls checkbox.