Amazon EMR
IntelliJ IDEA lets you monitor clusters and nodes in the Amazon EMR data processing platform.
Connect to an AWS EMR server
In the Big Data Tools window, click
and select AWS EMR.
In the Big Data Tools dialog that opens, specify the connection parameters:

Name: the name of the connection to distinguish it between the other connections.
Region: select a region to get clusters from.
Authentication type lets you select the authentication method:
Default credential providers chain: use the credentials from the default provider chain. For more information about the chain, refer to Using the Default Credential Provider Chain.
Profile from credentials file: select a profile from your file.
Explicit access key and secret key: enter your credentials manually.
With the Default credential providers chain or Profile from credentials file option selected, you can click Open Credentials to locate the directory where the credential file is stored. If you use the default location, it's usually ~/.aws/credentials on Linux or macOS, or C:\Users\<USERNAME>\.aws\credentials on Windows. Or it can be your custom location if you have selected Use custom configs.
Optionally, you can set up:
Per project: select to enable these connection settings only for the current project. Clear the checkbox if you want this connection to be visible in other projects.
Enable connection: clear the checkbox if you want to disable this connection. By default, the newly created connections are enabled.
HTTP Proxy: select if you want to use IDE proxy settings or specify custom proxy settings.
Click the Open SSH Key Settings link to create an SSH connection authenticated with a private key file. You need to specify the Amazon EC2 key pair private key in the EMR SSH Keystore dialog.
Once you fill in the settings, click Test connection to ensure that all configuration parameters are correct. Then click OK.
At any time, you can open the connection settings in one of the following ways:
Go to the Tools | Big Data Tools Settings settings page Ctrl+Alt+S.
Click
on the AWS EMR tool window toolbar.
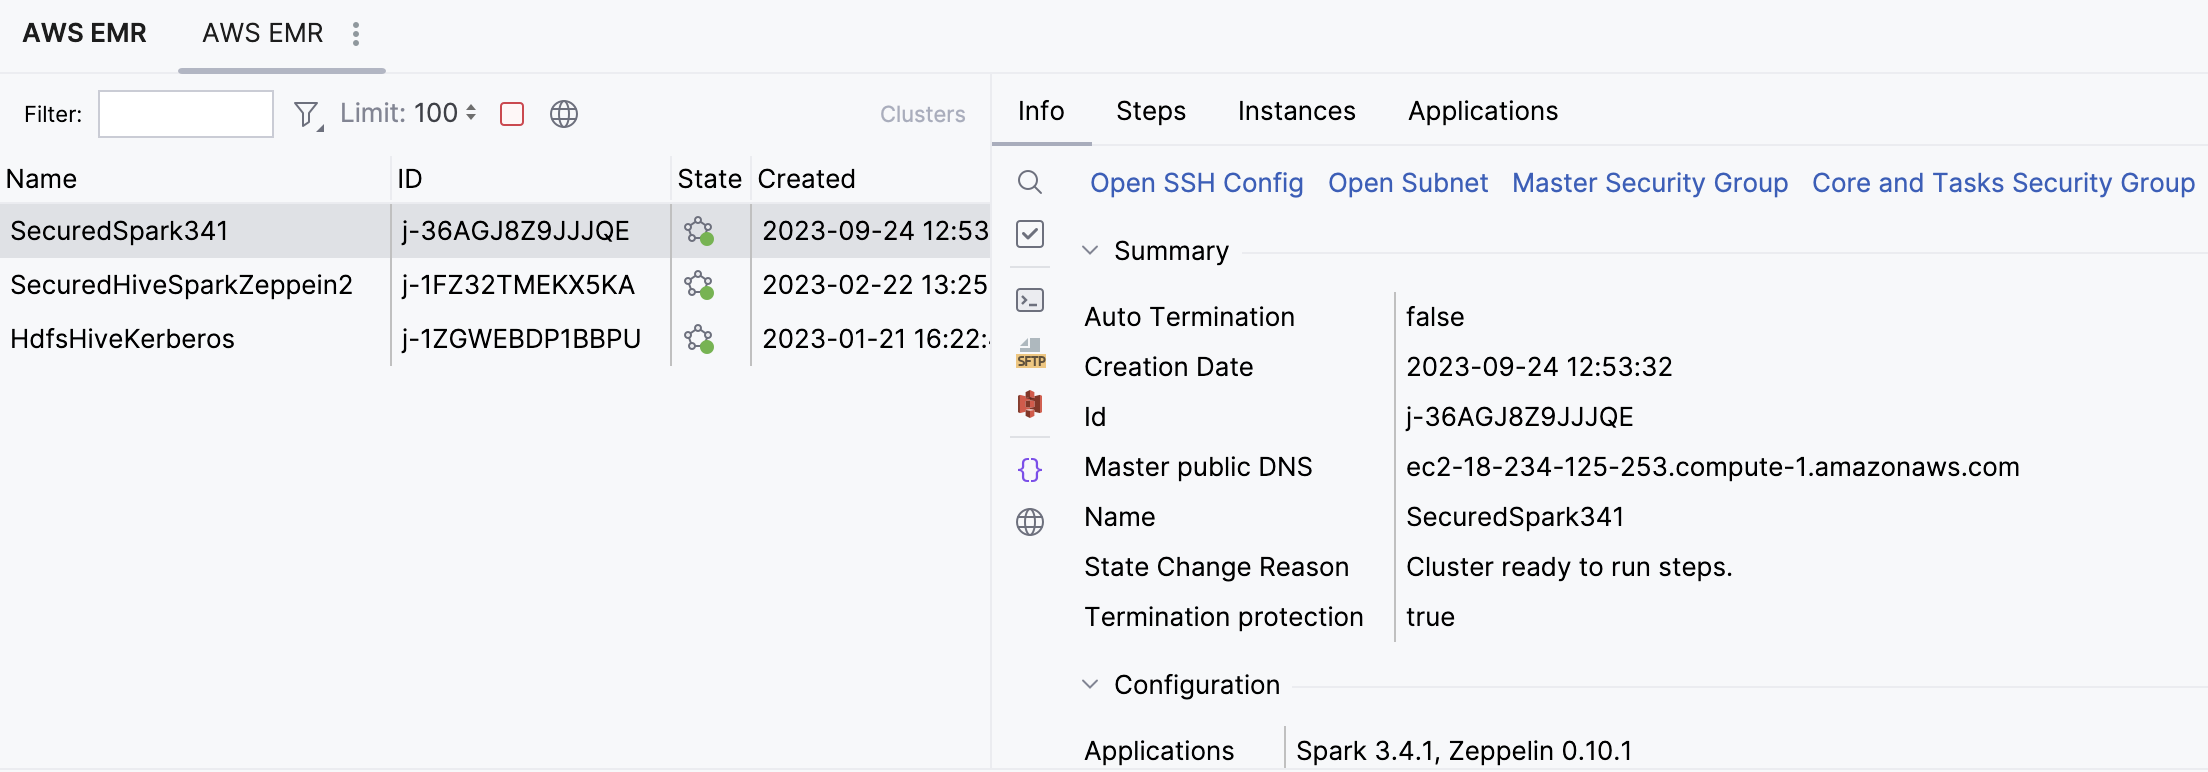
Once you have established a connection to the server, the AWS EMR tool window appears. You can filter clusters there by typing their name and by selecting their status or the time when they were terminated.

When you select a cluster in the AWS EMR tool window, you can use the following tabs to monitor clusters:

This tab shows details about the selected cluster. You can filter clusters by their names and ID by typing it in the Filter field.
Obtain more info
You can preview the cluster details in the web interface. Click
or Open Subnet, Master Security Group, or Core and Tasks Security Group.
Click
to establish an SFTP connection to the target server, then specify the path to the config file in your file system.
You can preview EMR logs for the selected cluster. Click
to open the logs in the Big Data Tools tool window, in the dedicated Remote File Systems viewer.
For JSON representation of the selected cluster configuration, click
(Show as JSON).

This tab shows application steps, their IDs, and execution status. You can filter steps by their names and ID by typing it in the Filter field.
Select a step to preview its details on the right side of the tool window, including the main class name, arguments, and link to the log folder.
Manage steps
Click
to preview the application step in the web interface.
You can add more steps of different types. Click
and select a step type to add. Then, specify its parameters.

Click
to duplicate the selected step.
For JSON representation of the selected step, click
.

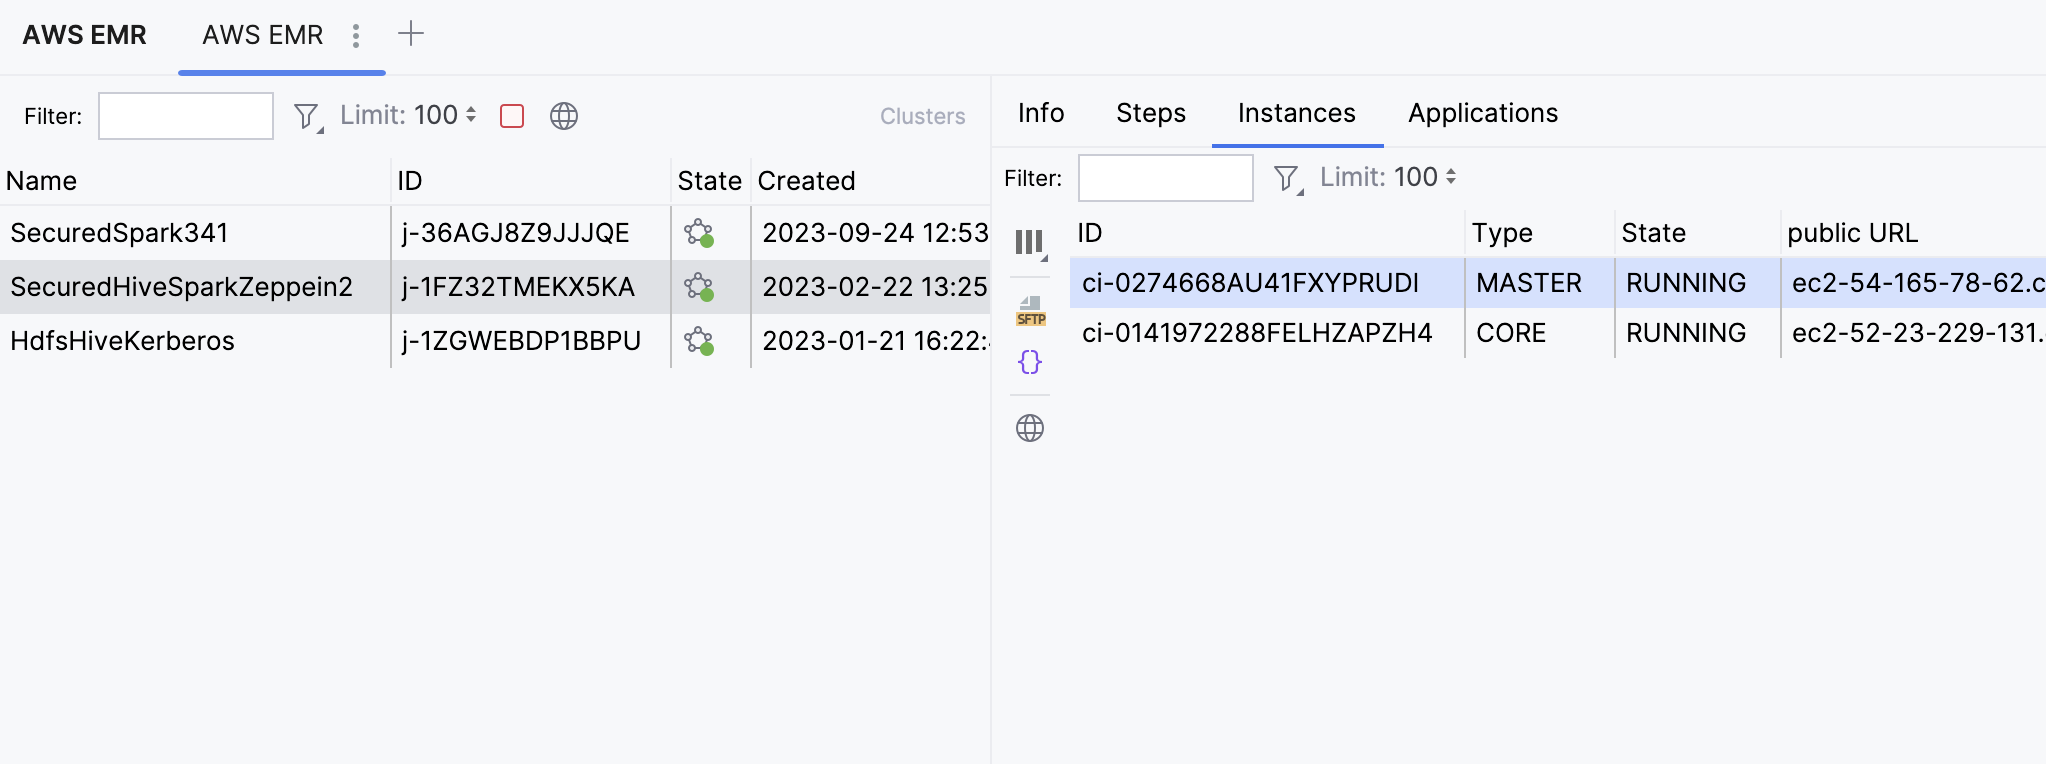
This tab shows details about instances of the selected cluster. You can start typing any instance name in the Search field and it will be selected.
View instances
You can preview the instance details in the web interface by clicking
. You can also click
to show or hide a particular parameter of instances.
Click
to establish an SFTP connection to the target server, then specify the path to the config file in your file system.
For JSON representation of the selected cluster configuration, click
.

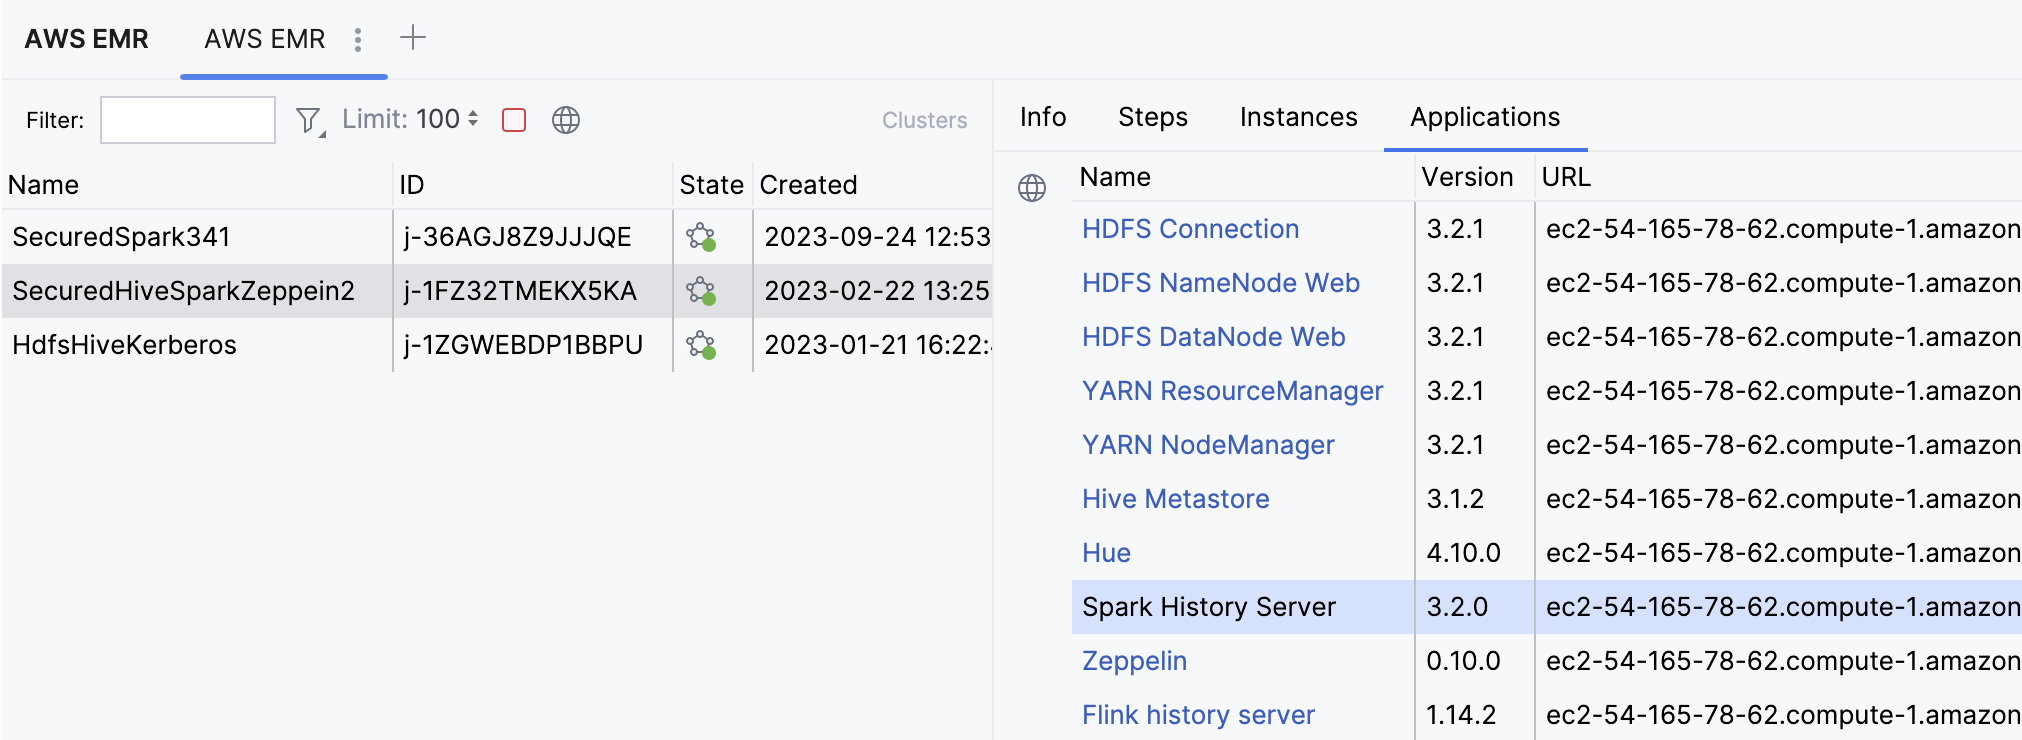
This tab shows applications running on the selected cluster. Click to preview the cluster details in your default web browser.
Open Amazon EMR applications
IntelliJ IDEA lets you open applications installed on your Amazon EMR cluster. You can open it in your default browser right from the AWS EMR tool window. Additionally, if a tool is supported by one of the Big Data Tools plugins (such as Hadoop, HDFS, Hive, Spark, or Zeppelin), you can create a connection to it in IntelliJ IDEA. In this case, a dedicated tool window will be opened in your IDE. For example, if you connect to a Zeppelin server, you can open and edit a Zeppelin note in the IntelliJ IDEA editor. Connections to applications are based on SSH tunneling, so you'll have to provide SSH keys configured in the cluster.
In the AWS EMR tool window, select your Amazon EMR cluster.
Open the Applications tab and, in the Name column, click the link to an application.
For applications that are supported by Big Data Tools plugins, select where to open it:
Open in Browser to open it in your default browser.
Create Connection to create a connection to the application within your IDE. A new connection will be displayed in the Big Data Tools tool window.
If this is the first time you try to connect to an application, you will be prompted to create a connection. Click Create and in the dialog that opens select your SSH key file, for example
mykey.pem.Once your SSH keys are loaded, you can connect to applications of this cluster just by clicking its name in the Applications tab.
In the Create Connection window that opens, select one of the following:
Use Defaults if you want to initiate a connection right away using the default settings.
Customize if you want to change some settings before connecting, for example, provide your Zeppelin user name and password.