Quick start with Go
This guide helps you get started with IntelliJ IDEA. You will learn how to create and open projects, work with files, run your code, and navigate around the IDE.
Start a Go project
After you install the Go plugin and launch it for the first time, you need to create a project. Everything in IntelliJ IDEA is done within the context of a project. A project serves as the foundation for code assistance, refactoring, consistent coding style, and other key features.
You have three options to start working on a project in the IDE:
Open an existing project
Check out a project from a version control system (VCS)
Create a new project
This quick start guide covers only how to create a new project.
Create a Go project
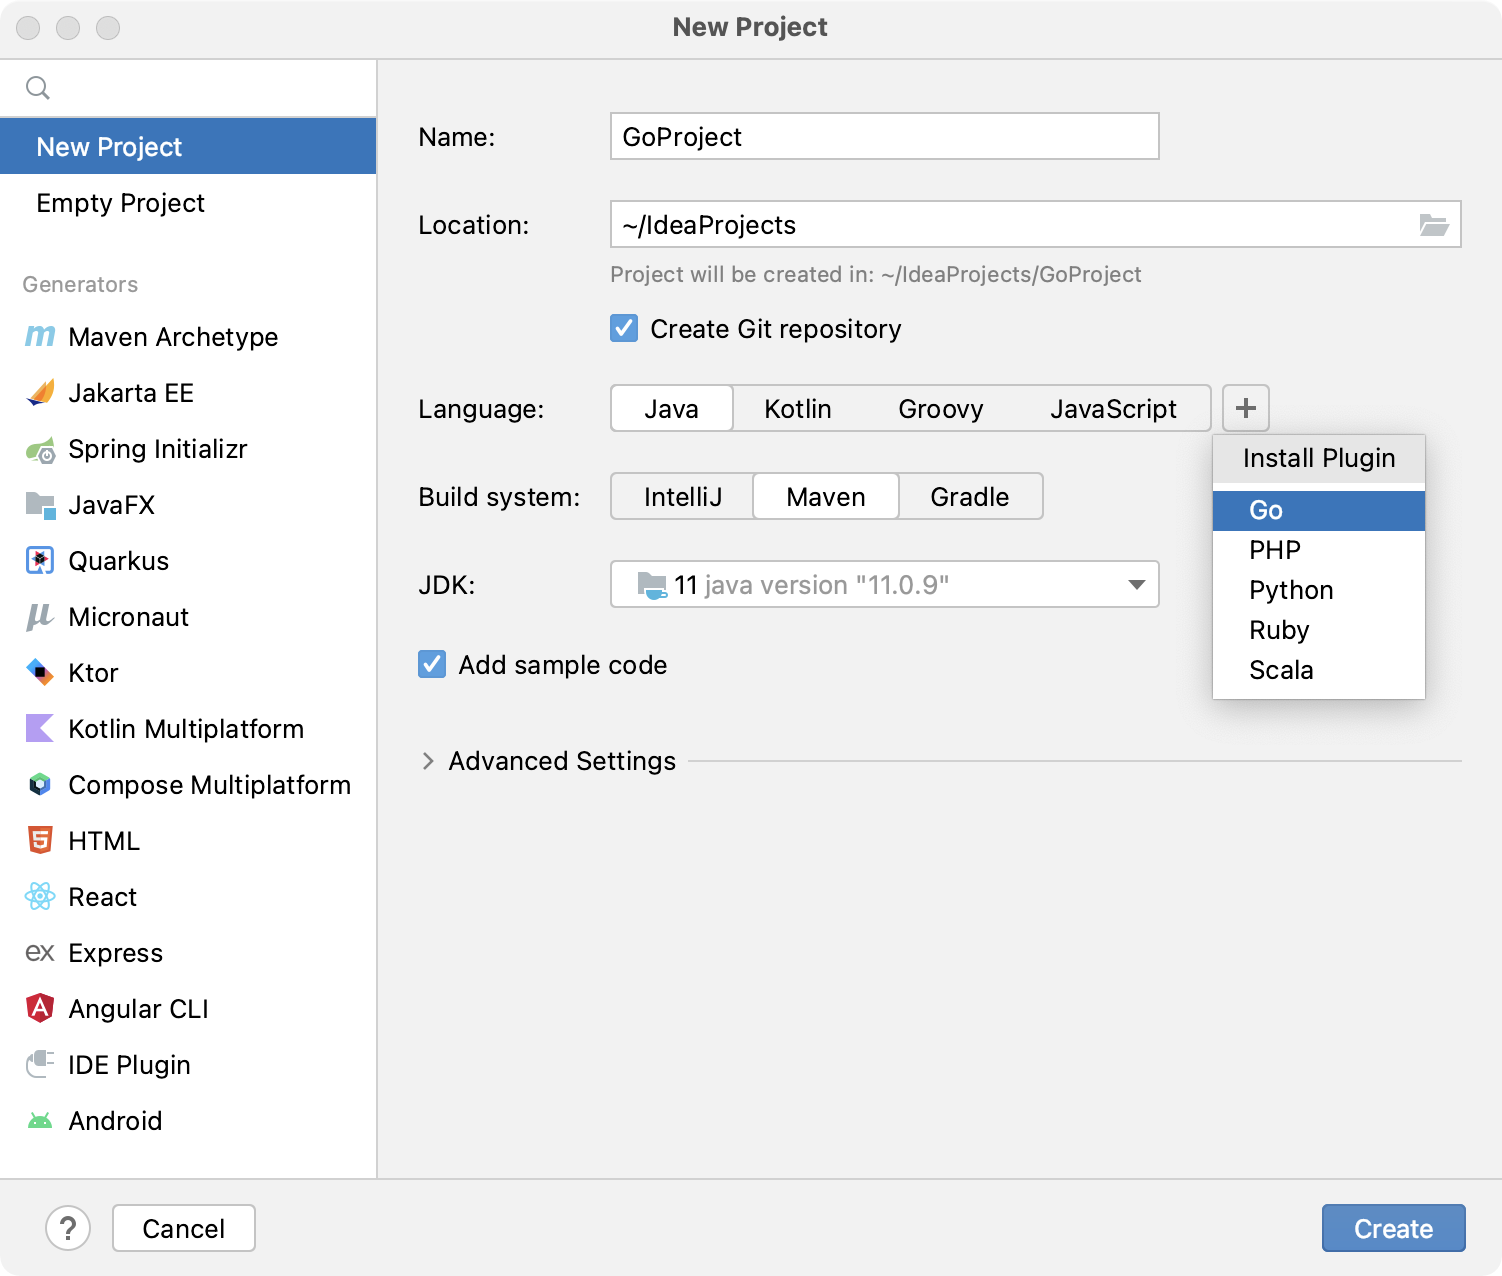
Select .
Alternatively, navigate to New | Project on the Welcome to IntelliJ IDEA dialog.
In the New Project dialog, select Go modules from the list of available project types.
Ensure that Go is selected as the project language in the Language list.
In the GOROOT field, specify the location of your Go installation. IntelliJ IDEA usually detects this location automatically.
To change or install a new Go SDK version, click Add SDK (
) and choose one of the following options:
Local: to use an existing SDK from your local system.
Download: to download a Go SDK version from the official repository.
Click Create to create the project.
Create a Go file
To create a Go file, use one of the following options:
In the Project tool window, right-click the parent folder of your project and select .
Click the parent folder of your project, press Alt+Insert, and select Go File.
Click the parent folder of your project, then go to .
In the New Go File dialog, enter a file name and choose the file type:
Empty file — creates an empty Go file.
Simple application — creates a Go file with a predefined
mainfunction.
Explore the user interface
When you launch IntelliJ IDEA for the first time, the Welcome to IntelliJ IDEA dialog appears. From this dialog, you can create or open a project, check out a project from a version control system, access documentation, and configure the IDE.
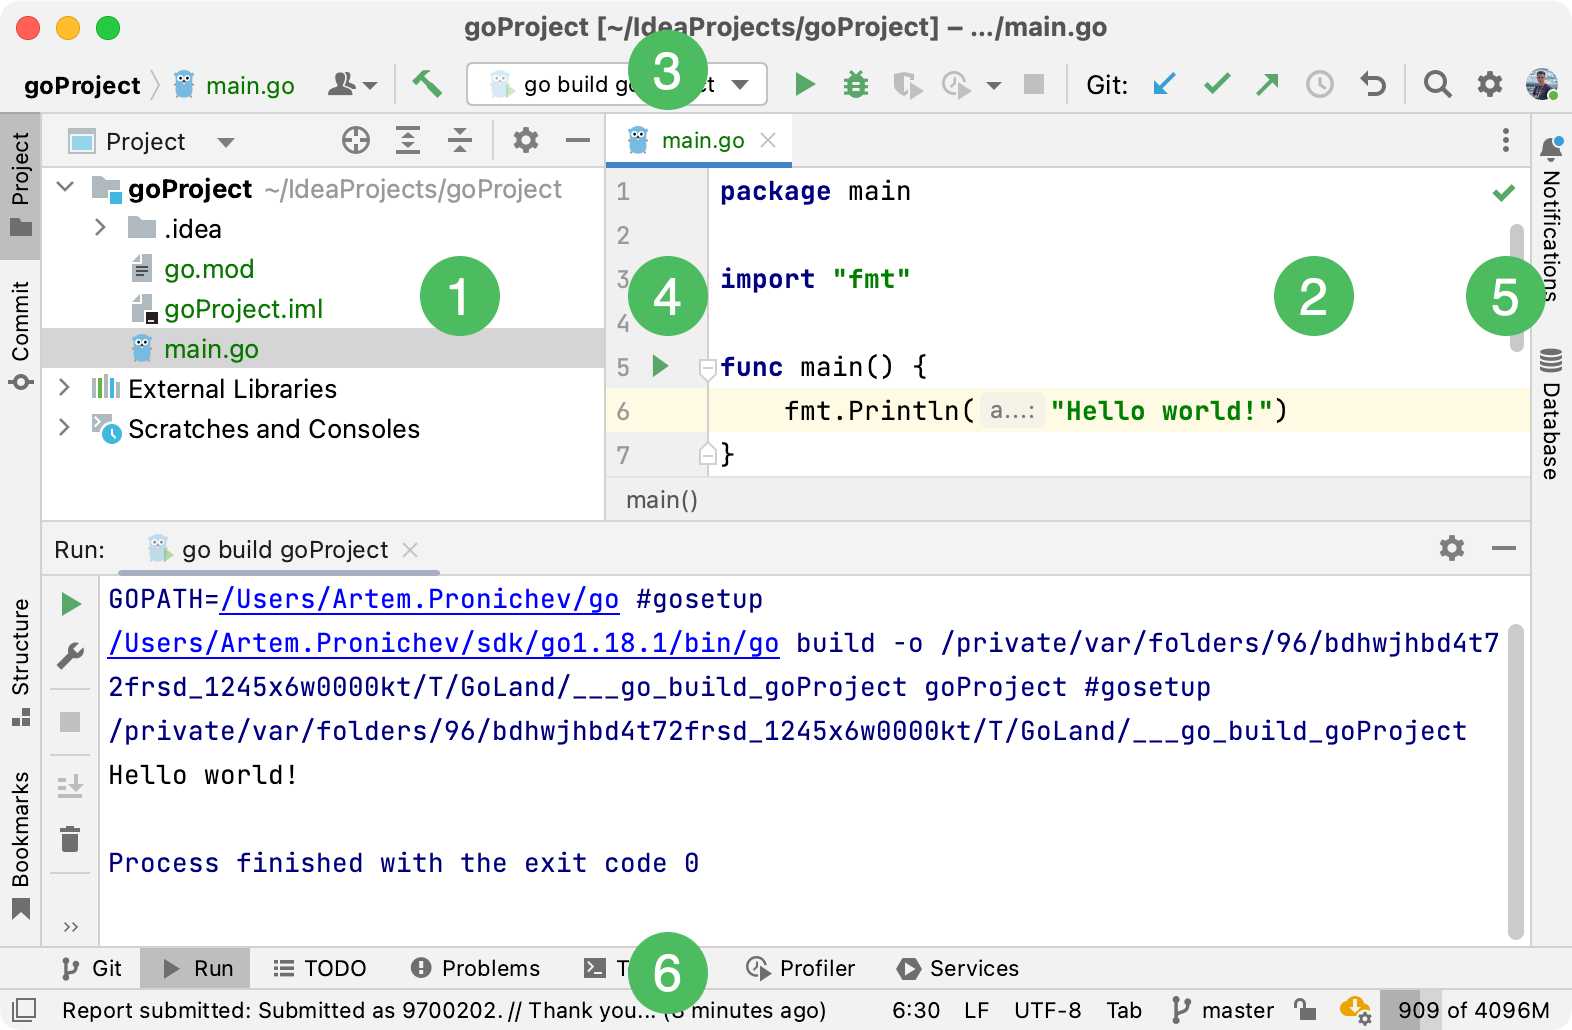
After you open a project, the main window appears, divided into several logical areas:
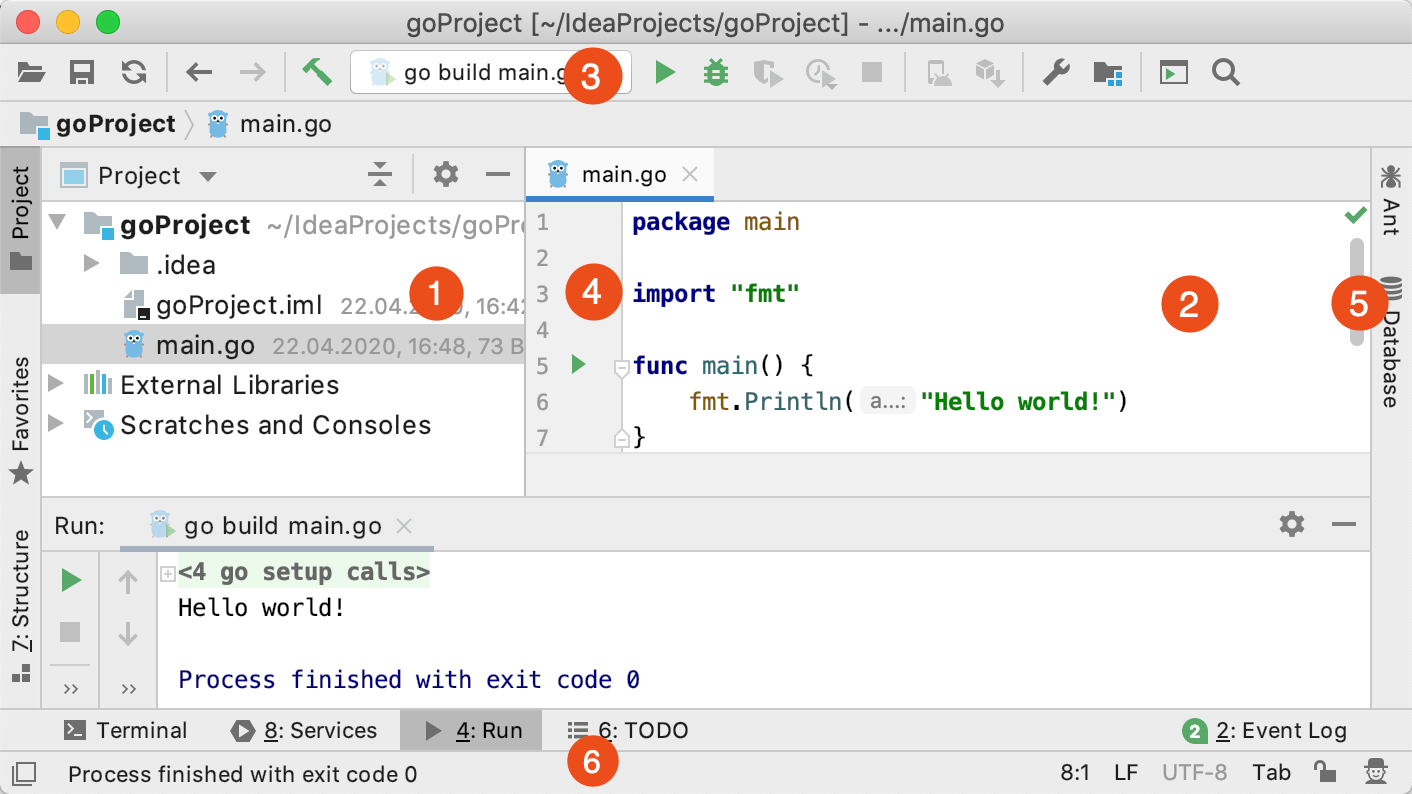
The Project tool window on the left side displays your project files. Tool windows help with project management, navigation, running and debugging code, version control integration, and more. To view all available tool windows, go to .
The Editor pane on the right is where you write your code. You can use tabs to switch between open files.
The navigation bar above the editor lets you quickly run and debug your application and perform basic version control actions.
The Gutter is the vertical strip next to the editor. It shows breakpoints and provides navigation to definitions or declarations. You can also click the Run Application icon (
) to run or debug your application.
The Scrollbar on the right side of the editor includes code analysis markers. IntelliJ IDEA continuously inspects your code and highlights issues like errors, warnings, and typos. The indicator at the top of the gutter shows the overall inspection status for the file.
The status bar displays the state of your project and the IDE. It provides details about file encoding, line separators, inspection profiles, and other useful messages.
In the lower-left corner of the IDE, in the Status bar, you can find the or
button. This button toggles the visibility of tool window bars. Hover over it to see a list of currently available tool windows.
Write your code
As you work in the editor, IntelliJ IDEA analyzes your code, suggests optimizations, and detects potential and actual issues. The features listed below can help you write code more efficiently and improve your overall development experience:
Refactorings
Refactoring is a process of improving your source code without creating a new functionality. Refactoring helps you keep your code solid , dry, and easy to maintain.
IntelliJ IDEA provides the following refactoring options:
Change signature: rename methods or functions, add, remove, or reorder parameters, and assign default values to new non-variadic parameters.
Extract refactorings: extract code fragments into constants, variables, methods, or interfaces to improve clarity and reusability.
Inline refactoring: move the contents of a method or variable directly into the place where it is used. This is the opposite of Extract refactoring.
Copy refactoring: copy a file, directory, or package to another location.
Move refactoring: move functions, types, or other code elements to different packages or files to improve project structure.
Code completion
IntelliJ IDEA provides two types of code completion:
Basic code completion Ctrl+Space helps complete names of types, interfaces, methods, and keywords within the current scope. Suggestions appear automatically as you type.
Smart code completion Ctrl+Shift+Space filters the list to show only values suitable for the current context.
The following animation demonstrates the difference between basic and smart type-matching completions. Notice the number of suggestions offered for each type:
Generating code
IntelliJ IDEA provides multiple ways to generate common code constructs and recurring elements, which helps you increase productivity. These can be either file templates used when creating a new file, custom or predefined live templates that are applied differently based on the context, various wrappers, or automatic pairing of characters.
You can generate getters, setters, constructors, missing methods, and test files.
Live templates
Use live templates to insert common constructs into your code, such as loops, conditions, declarations, or print statements.
To see the list of live templates, press Ctrl+Alt+S and go to .
The following animation shows how to create a
Hello Worldprogram using a live template:
Inspections
In IntelliJ IDEA, there is a set of code inspections that detect and correct abnormal code in your project before you compile it. The IDE can find and highlight various problems, locate dead code, find probable bugs, spelling problems, and improve the overall code structure.
Inspections can scan your code in all project files or only in specific scopes (for example, only in production code or in modified files).
Every inspection has a severity level — the extent to which a problem can affect your code. Severities are highlighted differently in the editor so that you can quickly distinguish between critical problems and less important things. IntelliJ IDEA comes with a set of predefined severity levels and enables you to create your own.
To view and configure inspections, press Ctrl+Alt+S and navigate to . You can enable or disable inspections and change their severity levels.
For example, the Unreachable code inspection detects unreachable code.
Intention actions
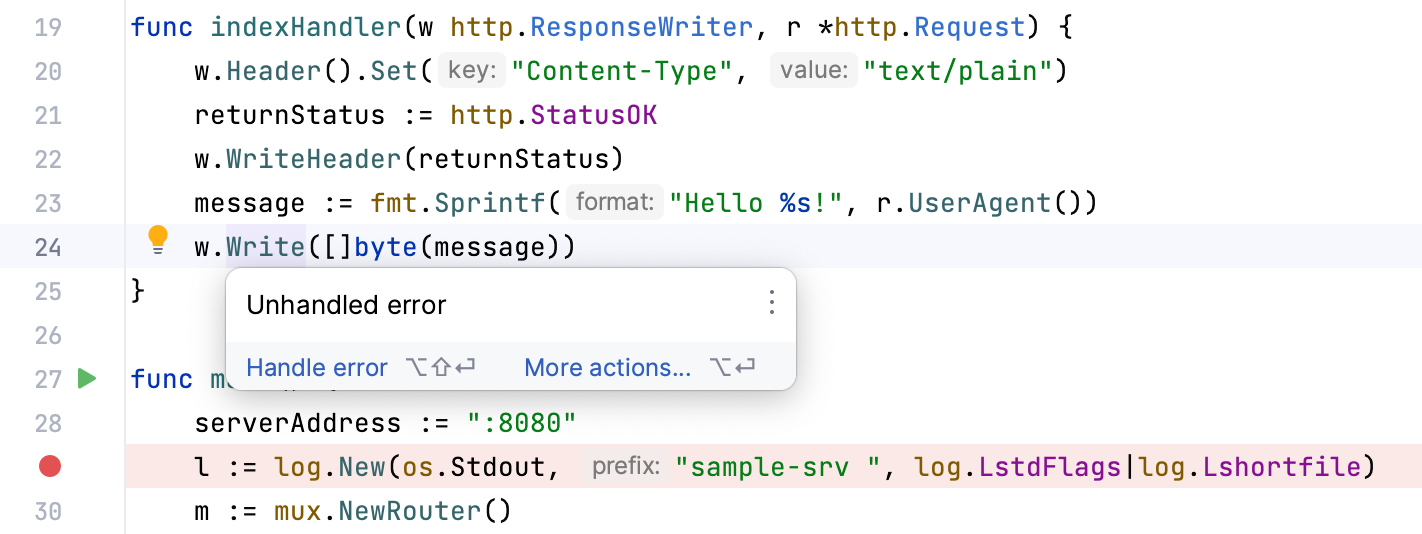
As you work in the editor, IntelliJ IDEA analyzes your code and searches for ways to optimize it. Intention actions cover a wide range of situations from errors and warnings to optimization suggestions.
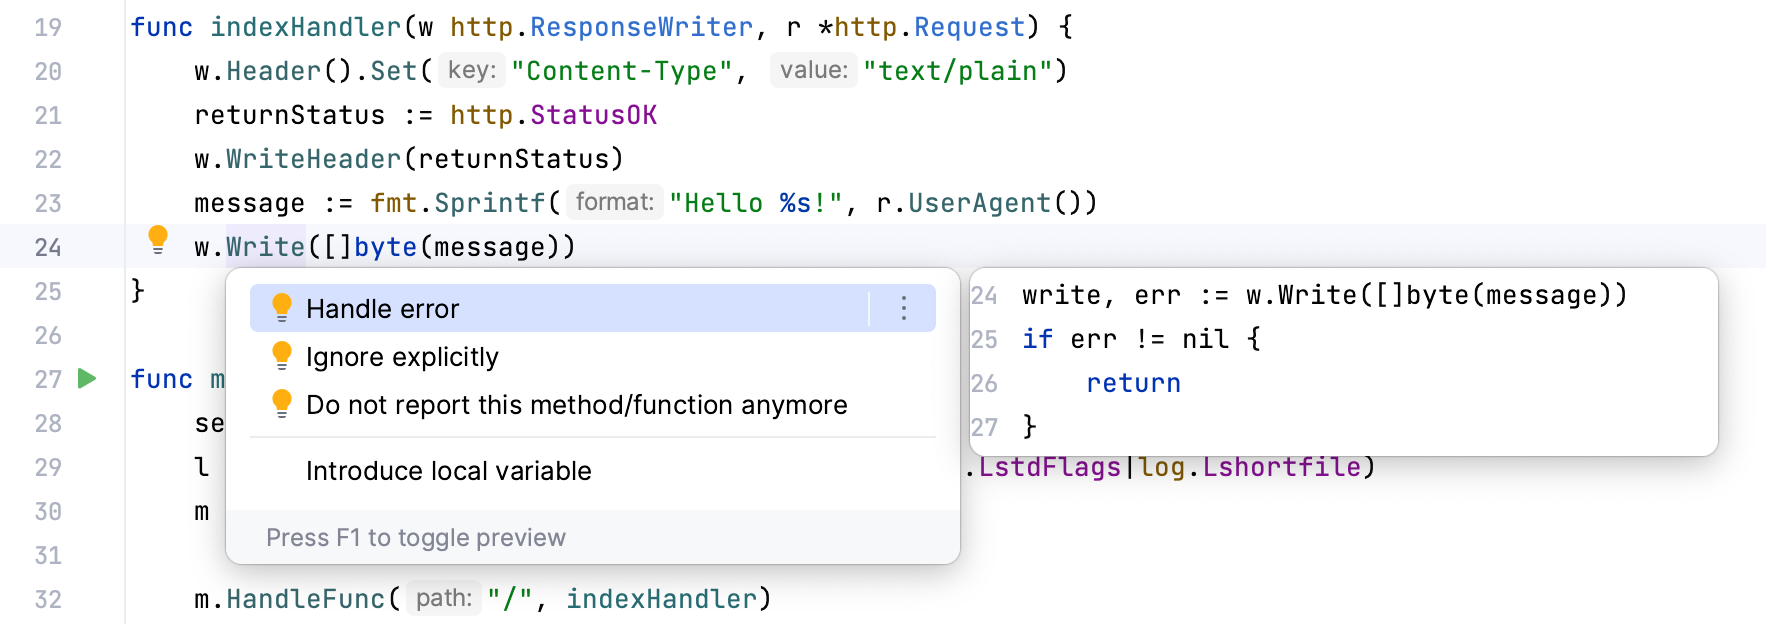
As soon as the IDE finds a way to improve your code, it displays a yellow bulb icon in the editor next to the current line. By clicking this icon, you can view the intention actions available in the current context.
To see the list of available intention actions, press Ctrl+Alt+S and navigate to .
Click the light bulb icon or press Alt+Enter to open the list of suggestions.
Select an action from the list and press Enter.
For example, you can use an intention action to inject another language into your code:
Run and debug your code
You can run and debug your code in IntelliJ IDEA using the keyboard, the context menu, the gutter menu, or by creating a Run/Debug configuration.
Run your code
To run your application, press Shift+F10, or click the Run Application icon
in the gutter and select Run <application_name>.

Debug your code
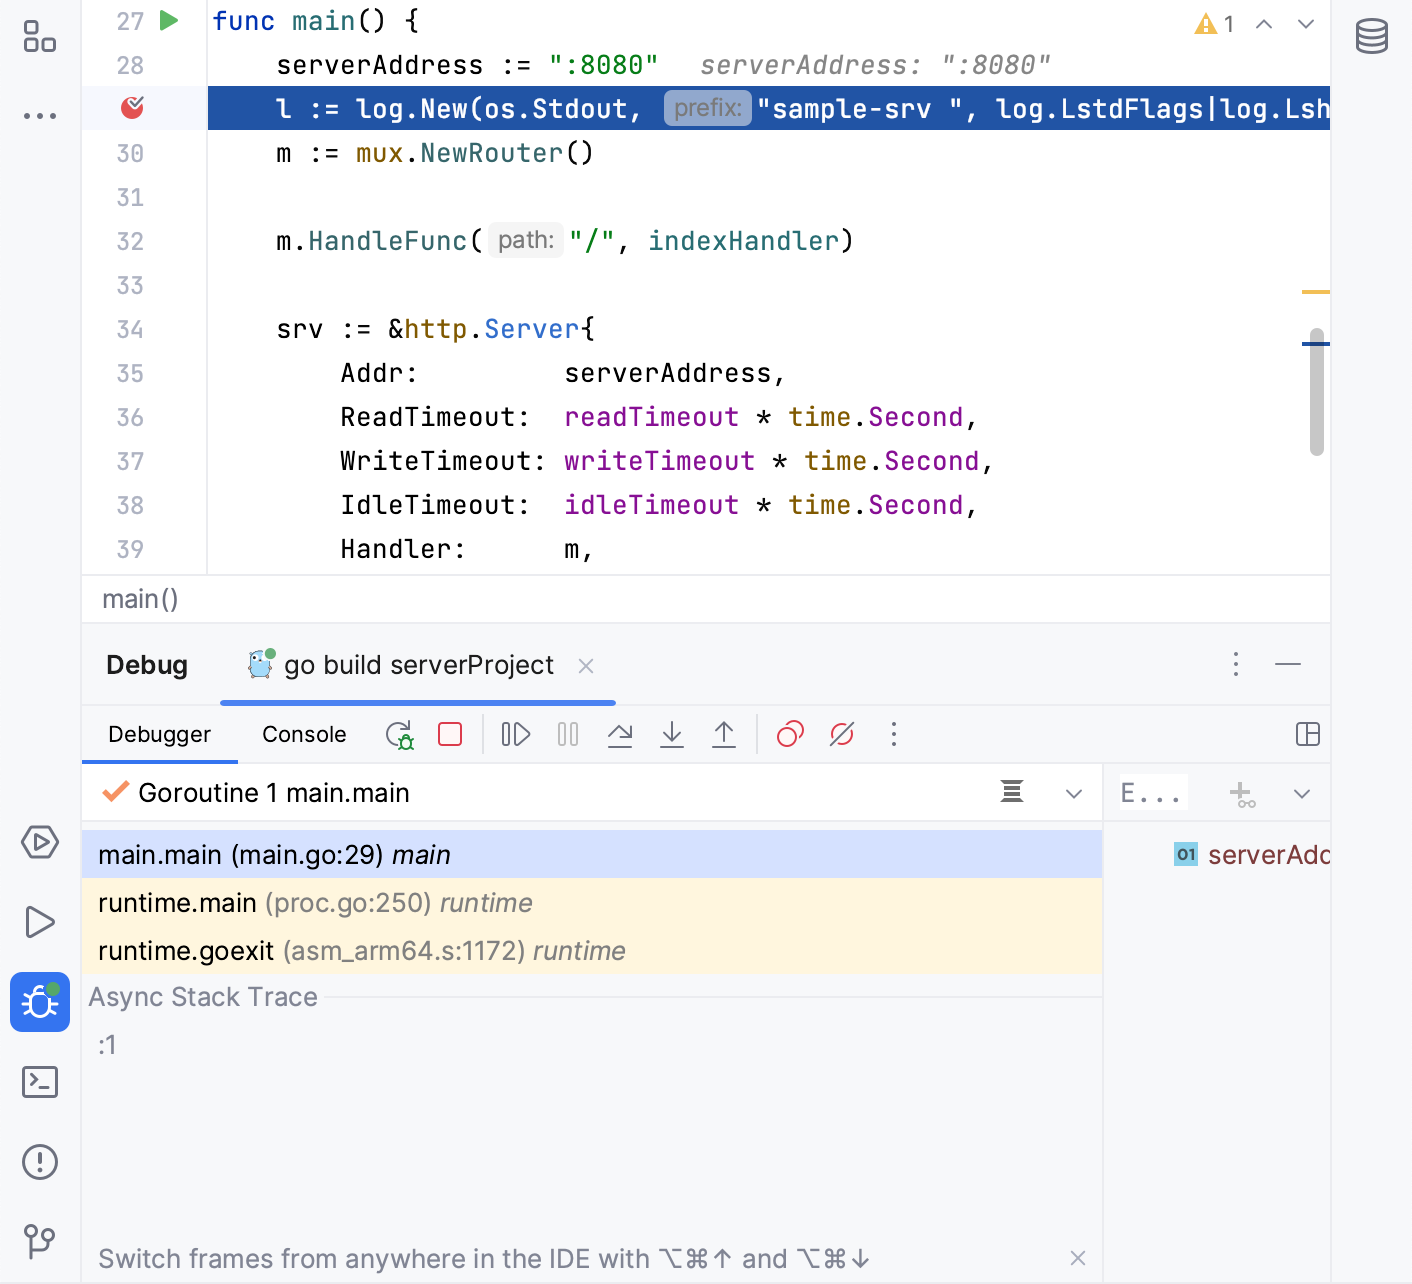
Debugging begins with placing breakpoints, which suspend program execution so you can inspect program data. To set a breakpoint, click the line number in the gutter where you want execution to pause.
To debug your application, press Shift+F9, or click the Run Application icon
in the gutter and select Debug <application_name>. Then, step through the execution using the options in the menu or the Debug tool window.
For more information, refer to Debugging.
