Services tool window
Run/Debug configurations
You can manage multiple run/debug configurations in the Services tool window. For example, you can start, pause, and stop several applications, track their status, and examine application-specific details.
Add Run/Debug configurations to the Services window
Select from the main menu or press Alt+8.
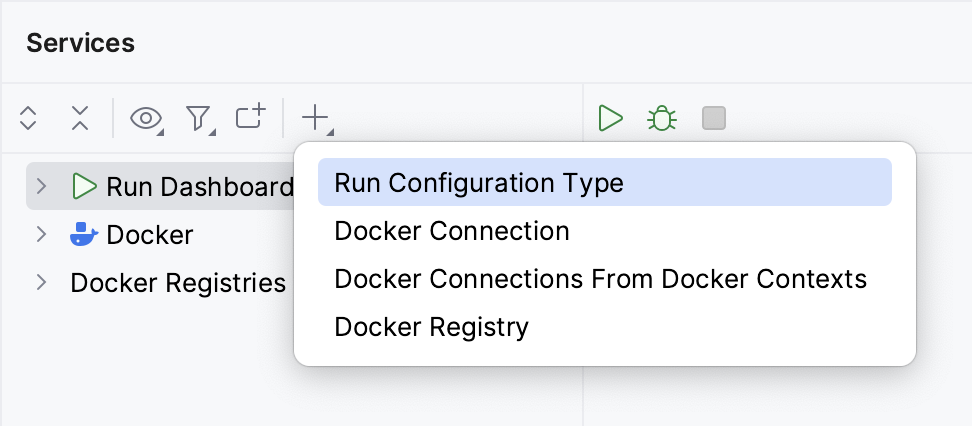
In the Services tool window, click Add service, then select Run Configuration Type.

Select a run/debug configuration type from the list to add all configurations of this type to the window.
Note that the tool window will only display the configuration types for which you have created one or more configurations.
Sessions
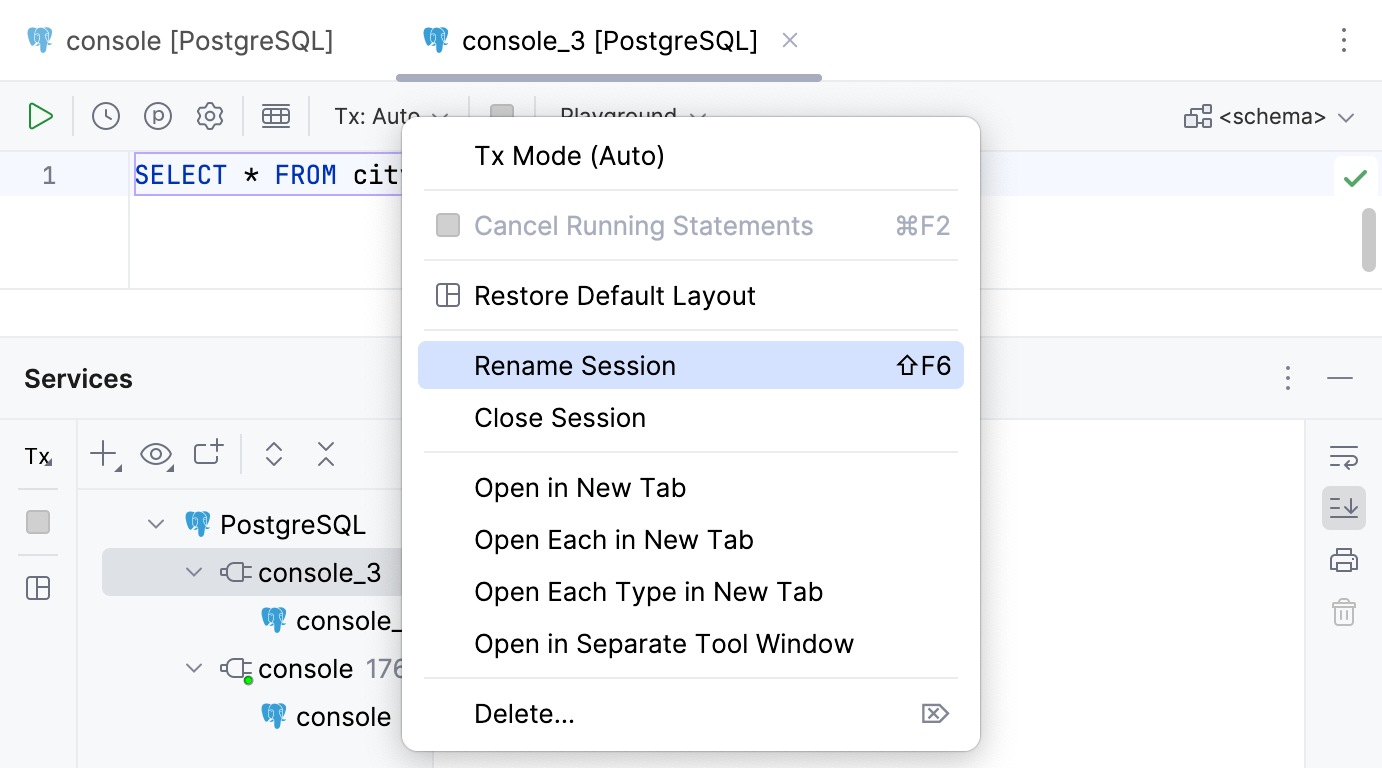
In Services tool window, you can rename, close, and switch sessions, switch to a single session mode, and so on.
For more information about about working with sessions, refer to Manage sessions.

Query result set and execution output
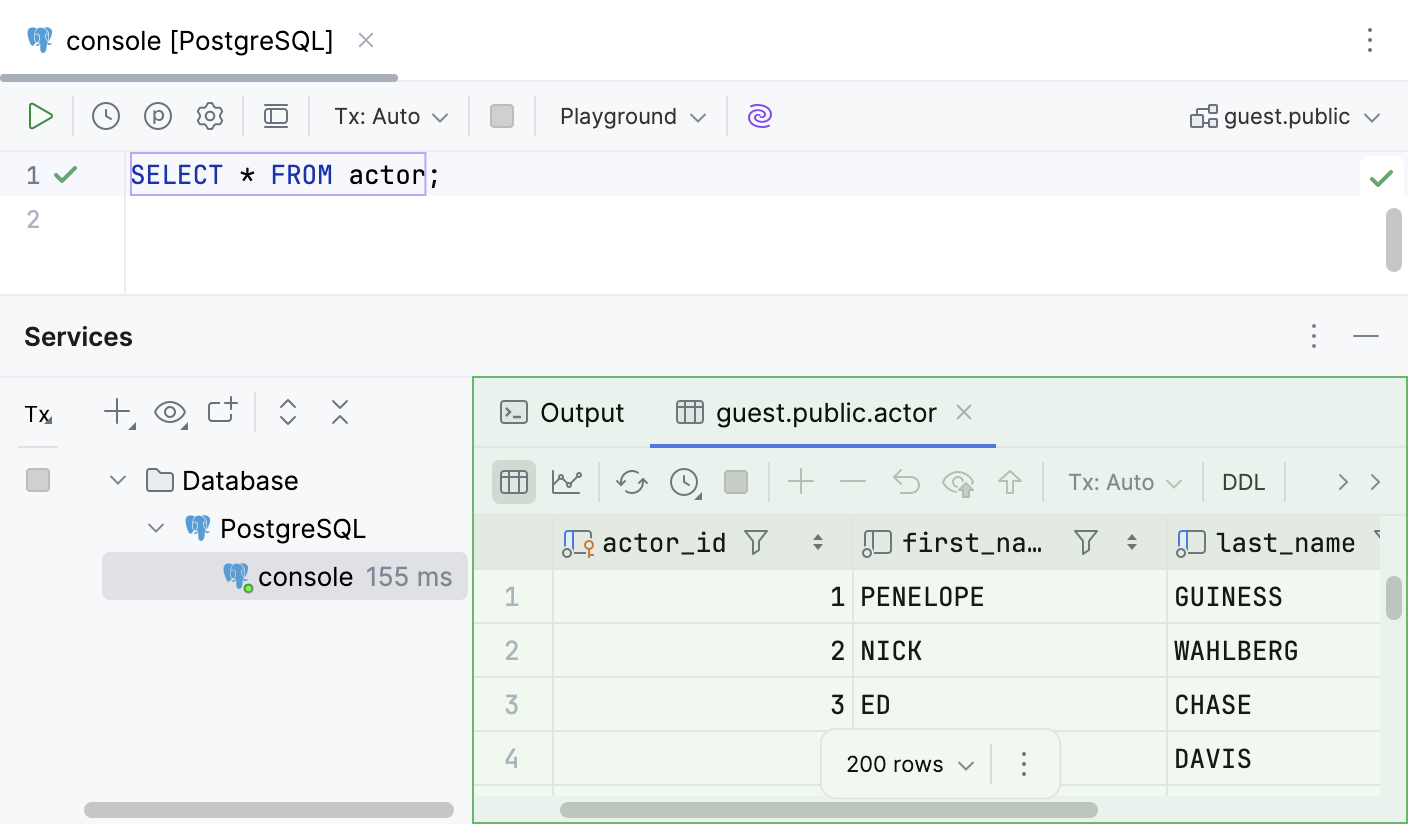
When you run a query, IntelliJ IDEA displays its result in the tabs of Services tool window.
For more information about viewing query results, refer to the Query results topic.
In the Result tab, you can see the data that was retrieved from the database in a table format.
For more information about the tab, refer to Result tabs in Services tool window and the tab reference info.

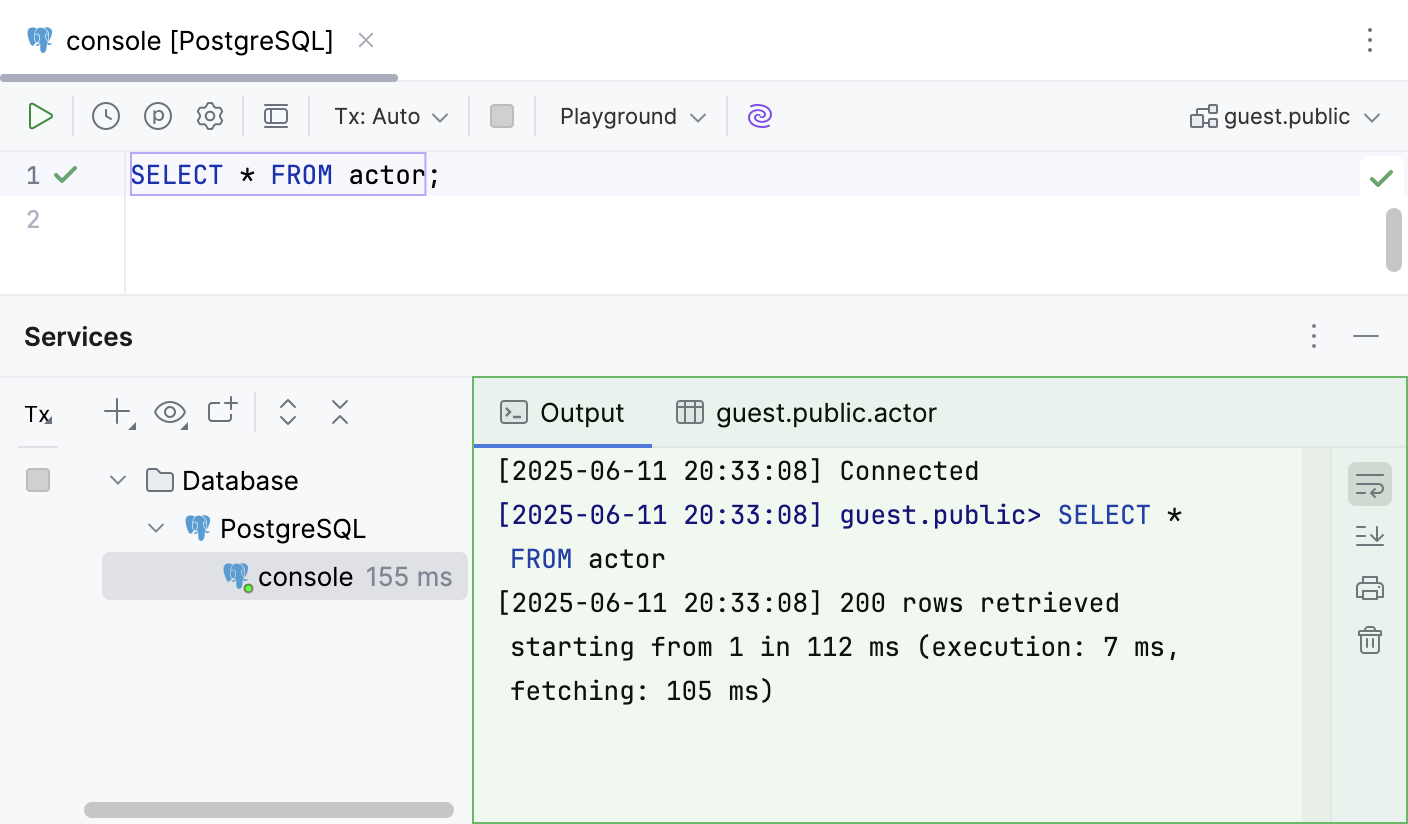
In the Output tab, you can view information about SQL statements and other operations that you performed in a query console.
For more information about the tab, refer to Output tab and the tab reference info.
