Using the MPS Debugger
Debugging
The MPS Debugger provides an API to create debuggers for custom languages. Java Debugger plugin, included into MPS distribution, allows user to debug programs which are written in languages which are finally generated into Base Language/Java. We use this plugin below to illustrate MPS Debugger features, which all are available to other lagnuages via API.
- Debugging
- Execution
- Creating an instance of run configuration
- Debugging language definitions
- Debugging a configuration
- Breakpoints
- Setting a breakpoint
- Viewing breakpoints via breakpoints dialog.
- Examining a state of a program at a breakpoint
- Runtime
- Controlling execution of a program
- Expressions
- Expression evaluation
- Watches
Execution
We start with description of how to debug a java application. If a user has a class with main method, a Java Application run configuration should be used to run/debug such a program.
Creating an instance of run configuration
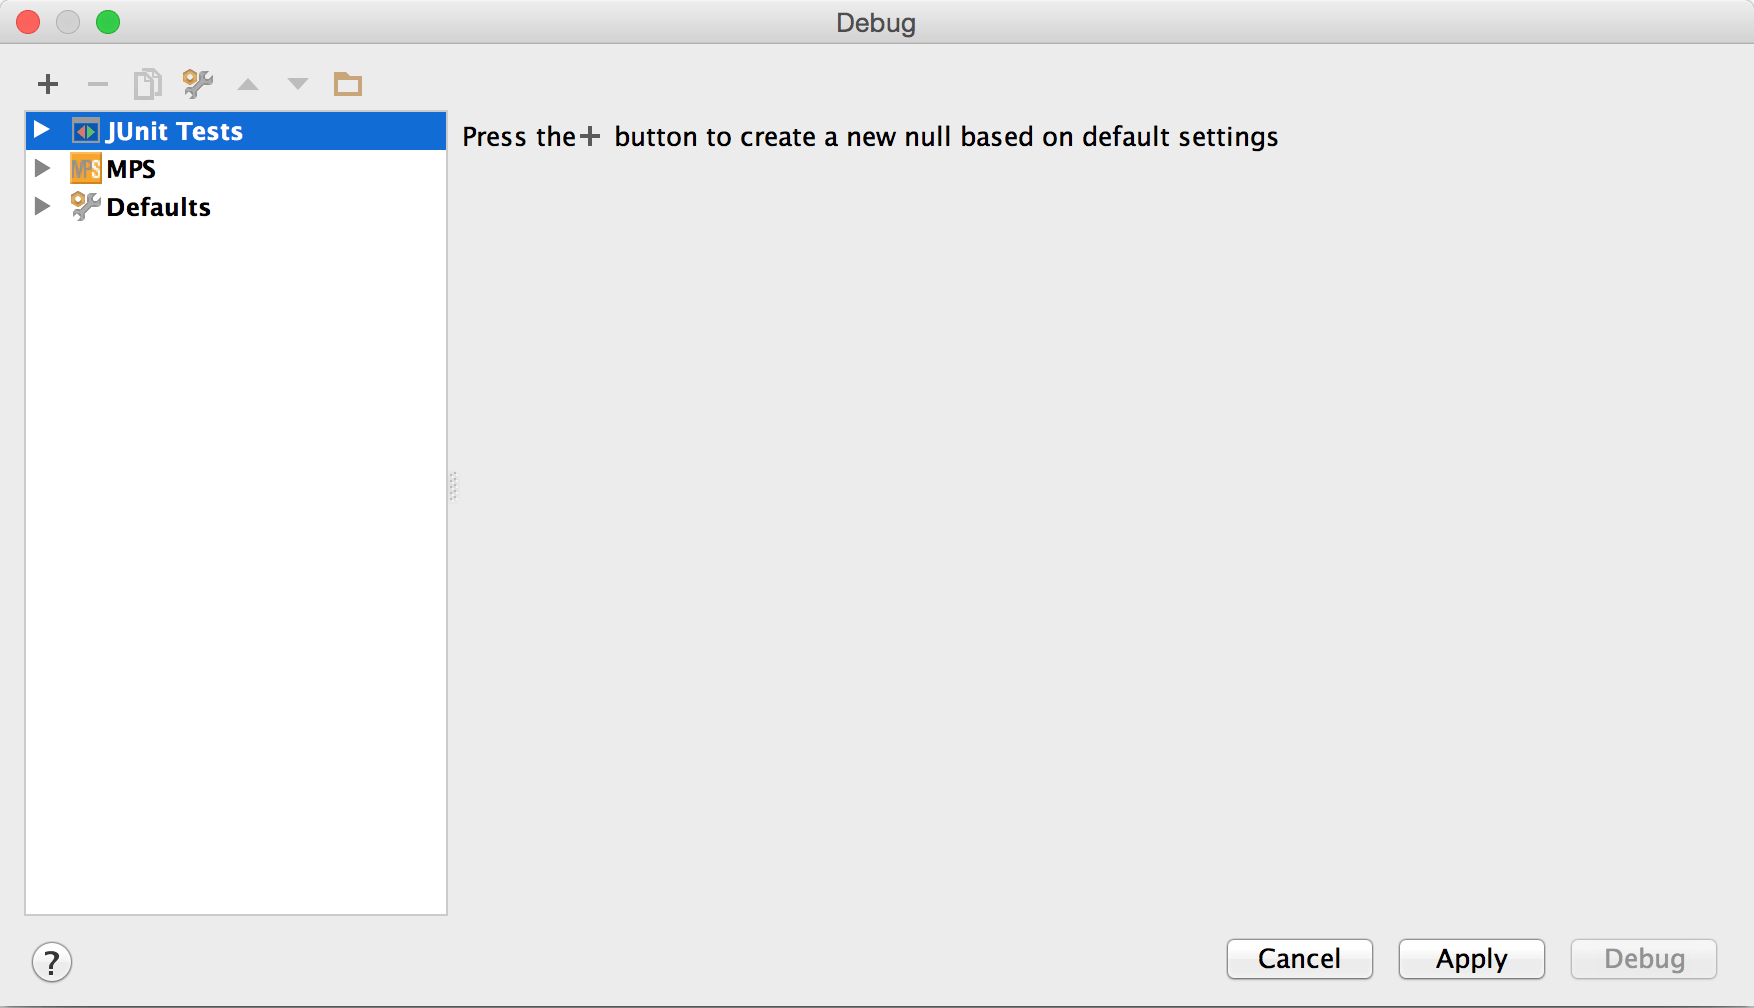
A Java Application or an MPS instance run configurations can be created for a class with a main method or an MPS project, respectively. Go to Run -> Edit Configurations menu and press a button with "+" as shown at the picture below:
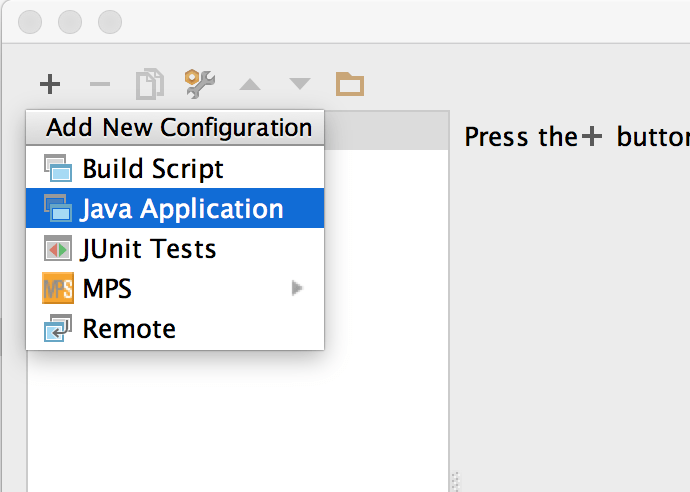
A menu appears, choose Java Application from it and a new Java Application configuration will be created:
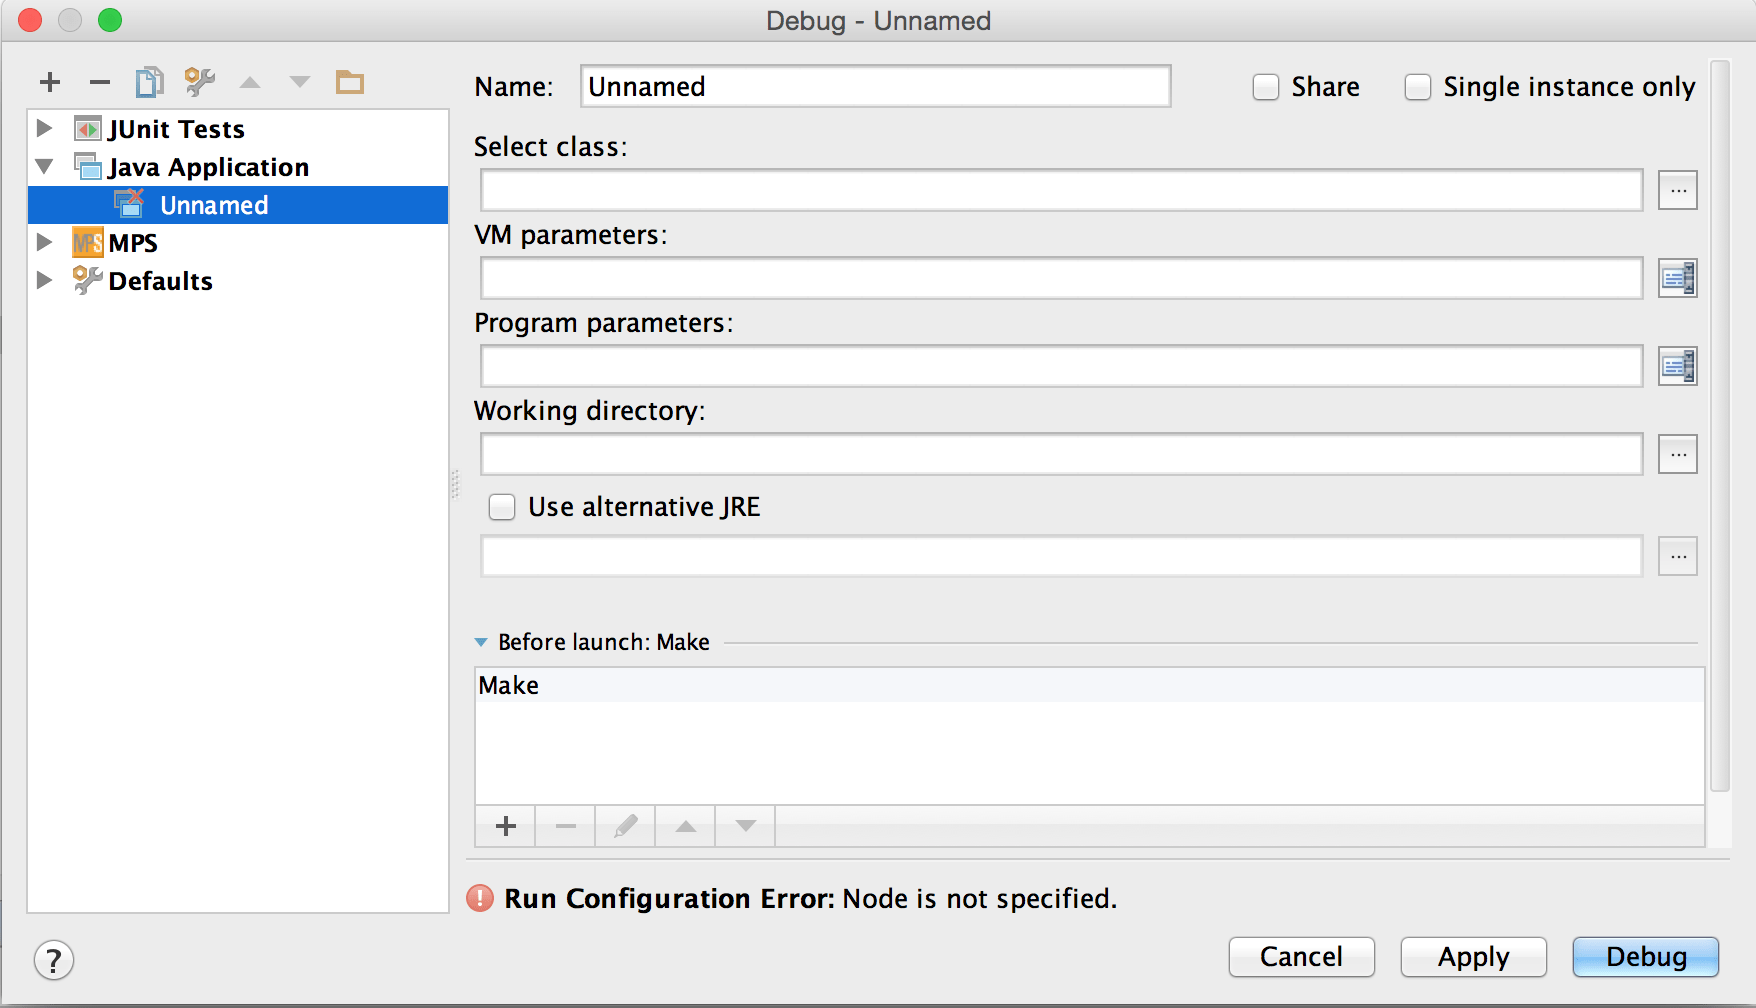
If you select Java Application, you will be able to specify the Java class to run, plus a few optional configuration parameters:
A name should be given to each run configuration, and a main node i.e. a class with a main method should be specified. Also VM and program parameters may be specified in a configuration. Look at Run Configuration chapter to learn more about run configurations.
Debugging language definitions
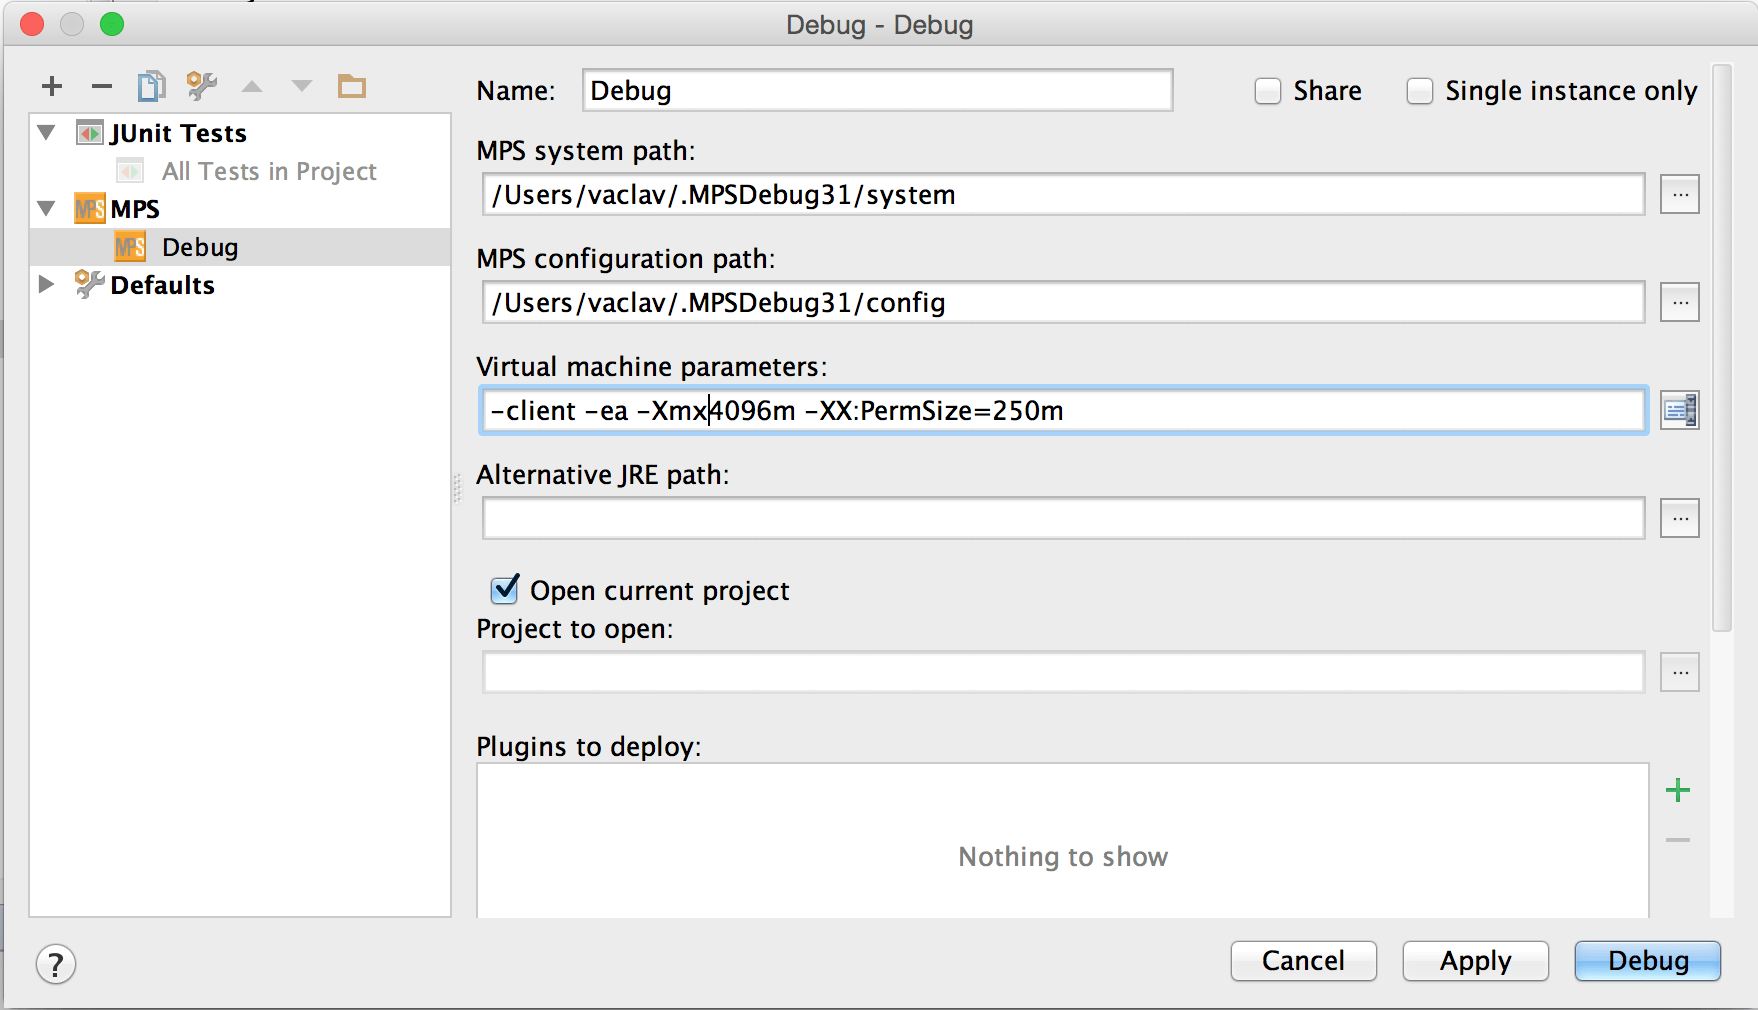
Select MPS instance, if you want to debug MPS language definition code. MPS will start a new instance of MPS with a project that uses your language (it could also be the current project) and you will set breakpoints and debug in your original MPS instance.
In the Debug configuration dialog you need to indicate, which MPS project to open in the new MPS instance - either the current one by checking the Open current project check-box, or any project you specify in the field below. You could also leave both empty and create/open a project from he menu once the new MPS instance starts.
Debugging a configuration
To debug a run configuration, select it from configurations menu and then press the Debug button. The debugger starts, and the Debugger tool window appears below.
There are two tabs in a tool: one is for the console view and other for the debugger view. In the console an application's output is shown.
Breakpoints
Next section describes breakpoints usage.
Setting a breakpoint
A breakpoint can be set on a statement, field or exception. To set or remove a breakpoint, press Ctrl-F8 on a node in the editor or click on a left margin near a node. A breakpoint is marked with a red bubble on the left margin, a pink line inside the editor and a red frame around a node for the breakpoint. Exception breakpoints are created from the breakpoints dialog.
When the program is stared, breakpoints on which debugger can not stop are specially highlighted.

When debugger stops at a breakpoint, the current breakpoint line is marked blue, and the actual node for the breakpoint is decorated with black frame around it.

If the cell for a node on which the program is stopped is inside a table, table cell is highlighted instead of a line.
Viewing breakpoints via breakpoints dialog.
All breakpoints set in the project could be viewed via Breakpoints dialog.
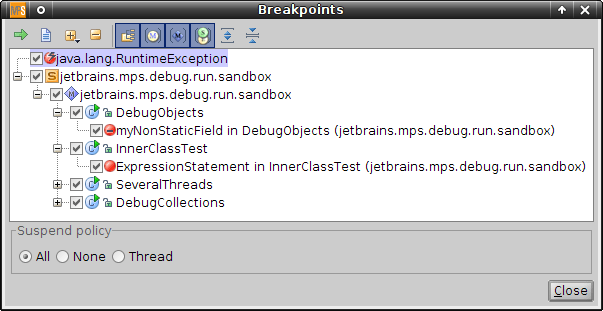
Java breakpoints features include:
field watchpoints;
exception breakpoints;
suspend policy for java breakpoints;
relevant breakpoint data (like thrown exception or changed field value) is displayed in variables tree.
Examining a state of a program at a breakpoint
When at a breakpoint, a Debugger tab can be used to examine a state of a program. There are three panels available:
a "Frames" panel with a list of stack frames for a thread, selected using a combo box;
a "Variable" tree which shows watchables (variables, parameters, fields and static fields) visible in the selected stack frame;
a "Watches" panel with list of watches and their values.

In java debugger "Copy Value" action is available from the context menu of the variable tree.

Runtime
Controlling execution of a program
To step over, use Run -> Step Over or F8.
To step out from a method, use Run -> Step Out or Shift-F8.
To step into a method call, use Run -> Step Into or F7.
To resume program execution, use Resume button or Run -> Resume or F9.
To pause a program manually, use Pause button or Run -> Pause. When paused manually, that is, not at a breakpoint, info about variables is unavailable.
There is a toolbar in Debugger window from where stepping actions are available.

Expressions
Expression evaluation
MPS Java debugger allows user to evaluate expressions during debug, using info from program stack. It is called low-level evaluation, because user is only allowed to use pure java variables/fields from generated code, not entities from high-level source code.
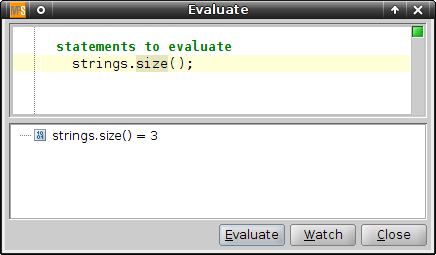
To activate evaluation mode, a program should be stopped at a breakpoint. Press Alt-F8, and a dialog appears.
In a dialog there's a MPS Editor with a statement list inside it. Some code may be written there, which uses variables and fields from stack frame. To evaluate this code, press Evaluate button. The evaluated value will appear in a tree view below.
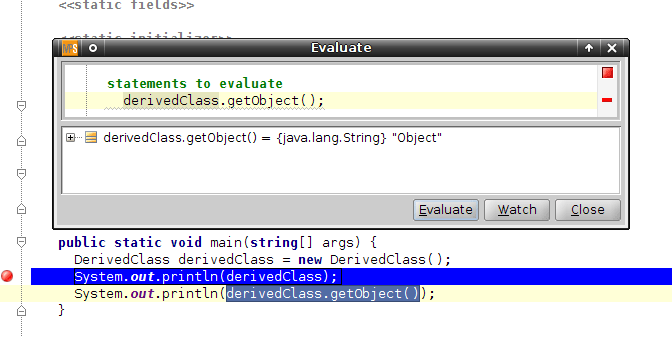
To evaluate a piece of code from the editor, select it and press Alt+F8, and the code will be copied to the evaluation window.
Watches
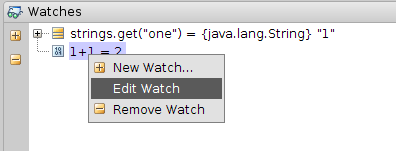
Watches API and low-level watches for java debugger are implemented. "Low-level" means that user can write expressions using variables, available on the stack. To edit a watch, a so-called "context"(used variables, static context type and this type) must be specified. If the stack frame is available at the moment, context is filled automatically.
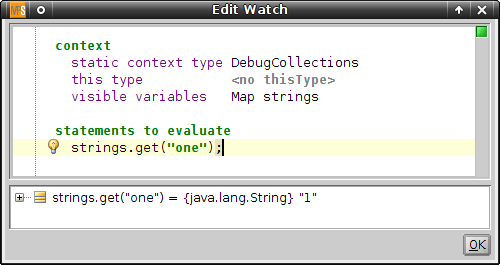
Watches can be viewed in "Watches" tree in "Debug" tool window. Watches could be created, edited and removed via context menu or toolbar buttons.
