Start the debugger session
Starting a debugger session is very similar to running the program in normal mode. The debugger is attached behind the scenes, so you don't have to configure anything specific to start a debugger session. If you are able to run your program from AppCode, you will also be able to debug it using the same configuration.
note
This topic relies on your understanding of run/debug configurations. While AppCode provides a way to debug simple applications without any extra setup, understanding run/debug configurations is essential to efficient use of the debugger. More on them here.
Each time you debug a program, the debugger session is based on a run/debug configuration. Thus, you can configure AppCode to use any parameters and perform any actions before the program is launched. For example, the configuration can build the application every time you start a debugger session or use the previously compiled code.
If you have a run/debug configuration and device chosen in the run/debug configurations selector on the toolbar, click
or press ⇧ F9.

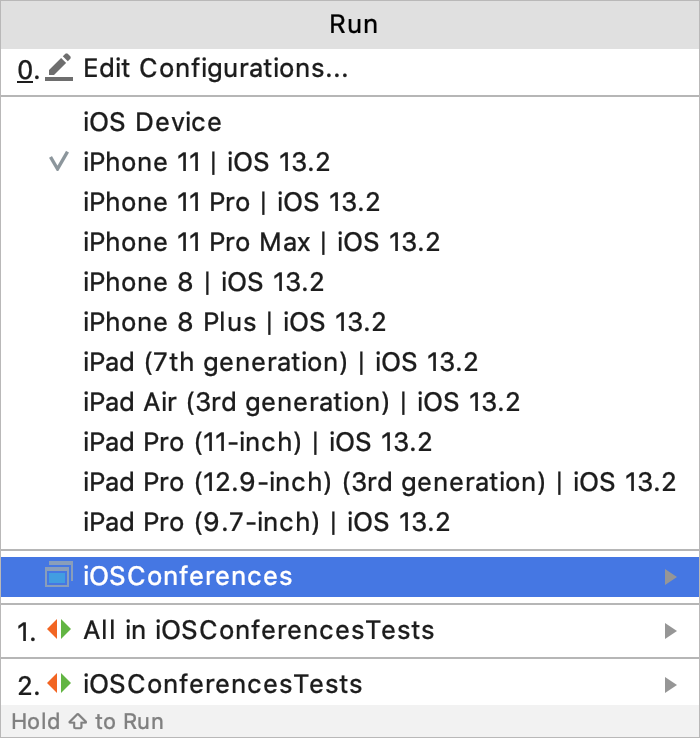
If you want to change a run/debug configuration or device before debugging, press ⌥ ⇧ F9 and select the desired configuration or device. The debugging session will start immediately.

If you want to edit a run/debug configuration before debugging, press ⌥ ⇧ F9, and then press 0. In the dialog that opens, select the desired configuration, alter the necessary settings, and click Debug.
Pause/Resume a debugger session
When the debugger session is running, you can pause/resume it as required using the buttons on the toolbar of the Debug tool window:
To pause a debugger session, click
.
To resume a debugger session, click
F9.
note
Pausing the program manually is not an alternative to using breakpoints as this method doesn't let you use the full range of debugger functionality. For example, you cannot evaluate expressions after pausing the program.
Terminate a debugger session
Click the Stop button in the Debug tool window. Alternatively, press ⌃ F2 and select the process to terminate (if there are two or more of them).
Productivity tips
- Debug non-responding applications
In case your application hung, pause the session to let the debugger get the information about its current state. You can then examine the program state and locate the cause of the problem.
- Do more with pause
When you need to evaluate an expression, and AppCode doesn't let you do that because you didn't stop at a breakpoint, you can advance your program a line further by stepping. After this, you will be able to use the debugger as if you had stopped at a breakpoint. While in some cases this may not be a valid solution, it may sometimes help you out.