Zero-configuration debugging
In case of zero-configuration debugging, you do not need to create any debug configuration. Instead, you open the starting page of your PHP application in the browser manually, and then activate the debugging engine from the browser, while PhpStorm listens to incoming debugger connections.
Initiate a debugging session
Before you start debugging, make sure that you have a debugging engine installed and configured properly. PhpStorm supports debugging with two most popular tools: Xdebug and Zend Debugger. These tools cannot be used simultaneously because they block each other. To avoid this problem, you need to update the corresponding sections in the php.ini file as described in Configure Xdebug and Configure Zend Debugger.
To initiating a zero-configuration debugging session, perform these general steps.
Validate the debugging engine installation
Do any of the following:
In the command line, run the
php --versioncommand. The output should list the debugging engine among the installed extensions:

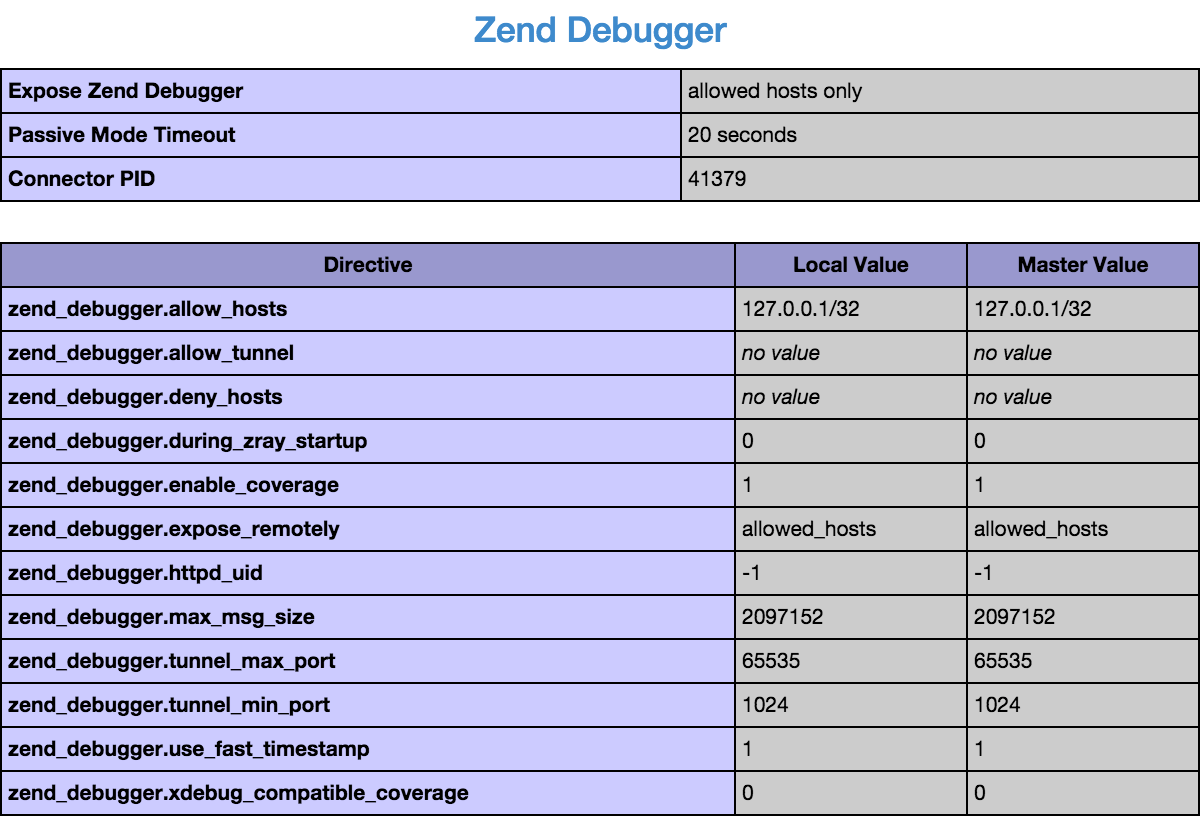
Create a php file containing the
phpinfo();function call. Then open this file in the browser. Thephpinfooutput should contain the section for your debugging engine:

Enable listening to incoming debugging connections
Toggle the Start Listen PHP Debug Connections button
on the PhpStorm toolbar so that it changes to
. After that PhpStorm starts listening to the port of the debugging engine used in the current project. Debugging ports are set at the PhpStorm level on the PHP | Debug page of the Settings/Preferences dialog Ctrl+Alt+S.

Set breakpoints in your code
Set a breakpoint in your code by doing any of the following:
Click the left gutter area at a line where you want to toggle a breakpoint.
On the main menu, choose .
Press Ctrl+F8.

Alternatively, select to have the debugger stop as soon as connection with PhpStorm is established (instead of running automatically until the first breakpoint is reached).
Activate debugger on server
To enable starting and stopping the debugging engine from the browser, you need to set a special
GET/POSTorCOOKIEparameter. You can do it manually in the php.ini configuration file, or use one of the available browser debugging extensions. If you are using a browser for which an extension is not available, you can generate the Start Debugger/ Stop Debugger bookmarklets and add them to your browser's toolbar.Activate the debugging extension in your browser:

For more details about setting the parameters manually, see Starting the Debugger for Xdebug and Zend Debugger GET Request Parameters for Zend Debugger.
Start the debugging session
Reload the page in the browser and return to PhpStorm. In the Incoming Connection From <Debugging Engine> dialog, select the path mappings so that PhpStorm can map the remote files on the web server to the local files in your project. If you have a deployment configuration defined, PhpStorm will offer to configure the mappings based on the paths you've already set in that configuration.

After reaching the breakpoint, the debugger is suspended. You can now investigate the application.

Continue running the program and examine its frames as soon as it is suspended again.
To control the program execution manually, step through the code using the commands under the Run menu or toolbar buttons: F7, Shift+F8, F8, and others. For more details, see Step through the program.
To have the program run automatically up to the next breakpoint, resume the session by choosing or pressing F9.
Specify the scripts to skip requests to
You can also specify the scripts requests to which you want PhpStorm to ignore during debugging. This approach can be useful, when your application contains scripts that use AJAX. Suppose you have a menu-ajax-script.php that "reloads" a part of your web page. This script works properly so you do not need to debug it. However, this script is still requested during the debugging session. To have incoming connections to this script ignored, add the menu-ajax-script.php script to the skipped paths list.
In the Settings/Preferences dialog Ctrl+Alt+S, go to .
On the Skipped Paths page that opens, configure an "ignore list" of scripts and folders with scripts not to be invoked if PhpStorm receives incoming connections to them.
To add a new entry to the list, click the
or press Alt+Insert. Then click
and in the dialog that opens choose the file or folder to skip connections to.
To remove an entry from the list, select it and click
or press Alt+Delete. The script will be now executed upon receiving requests to it.
To have PhpStorm inform you every time it receives a request to a script to be skipped, select the Notify about skipped paths checkbox.