Find unused code with coverage
PhpStorm lets you find unused JavaScript, TypeScript, and CSS code in your client-side applications. When you run an application in the special Code Coverage mode, PhpStorm creates a report showing how much code in every file and folder was used. Thanks to source maps, this report shows coverage for your source files but not for the compiled code that was actually run in the browser.
Run an application in the Code Coverage mode
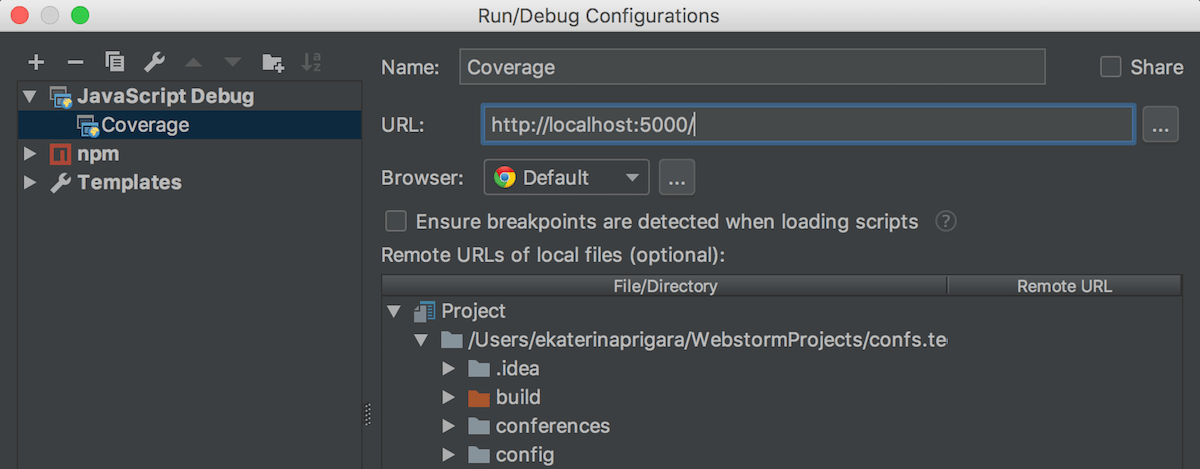
Create a run/debug configuration of the type JavaScript Debug:
Choose from the main menu, In the Edit Configurations dialog that opens, click
on the toolbar and select JavaScript Debug from the list. In the Run/Debug Configuration: JavaScript Debug dialog that opens, specify the URL address at which the application is running. This URL can be copied from the address bar of your browser.

Choose the newly created configuration in the Select run/debug configuration list on the toolbar and click
next to the list.

The URL address specified in the run configuration opens in the browser.
To learn what code was executed during the page load, just load the application and then stop it by clicking
on the toolbar, next to
, or in the Run tool window. If you need a coverage report for some specific features of your application, trigger these features in the browser and only then click
to stop the application.
View the report in the Coverage tool window. The Project tool window shows information about the coverage of files and folders. In the editor, the gutter shows green markers next to the lines that were executed and red markers next to those that were not. You can also hover over the line markers and see how many times each line of code was hit.
