Dart analysis tool window
The tool window is available only when the Dart plugin is installed and enabled. The Dart plugin is not bundled with PhpStorm, but it can be installed on the Settings/Preferences | Plugins page, tab Marketplace, as described in Installing plugins from JetBrains repository.
PhpStorm integrates with the Dart Analyzer tool that performs static analysis of your Dart source code. All inconsistencies and potential problems are reported in the Dart Analysis tool window with the possibility to navigate to the fragment of the source code where the problem was detected.
Messages List
All the problem reports are displayed in a table which consists of two columns, Description and Location, and a summary below.

The Description column shows the message itself, which can be an error message, a warning, or a hint.
The Location column shows the following data:
The name of the Dart package in which the problem arose. The Dart package name corresponds to the
project namefrom pubspec.yaml.The relative from the Dart package root to the file where the problem arose.
The line number where the problem arose.
The Summary area below the table shows the number of detected errors, warnings, or hints and the filter status.
Grouping and Sorting
The messages in the Dart Analysis tool window can be grouped and sorted. By default, the messages are primarily sorted by their severity, that is, the error messages are shown at the top of the list, then come warnings, and finally hints are displayed. In each severity group, messages are grouped by the Dart package name, which is super handy for projects with multiple pubspec.yaml files. In each package group, the messages are grouped by their file paths. Finally, in each file group, the problems are sorted by the line number where they occurred.
You can re-configure the secondary sorting:
Click the Location column header to switch between the ascending and descending order of the Dart package name + file path sorting. Note that this does not affect the order of severity groups, that is, errors are always shown first. Line numbers are not taken into consideration either, for each particular file problems are always shown in ascending order of line numbers.
Click the Description column header to perform the secondary sorting alphabetically by the problem description. Note that this does no affect the primary grouping by severity.
To disable the primary grouping by severity, release the Group by Severity toggle button ![]() on the toolbar. After that the severity of a problem is not taken into consideration at all and problem reports are sorted only by their Description or Location (Dart package name + file path). This sorting method guarantees that all the problems for each particular file are grouped together in the table, regardless of their severity.
on the toolbar. After that the severity of a problem is not taken into consideration at all and problem reports are sorted only by their Description or Location (Dart package name + file path). This sorting method guarantees that all the problems for each particular file are grouped together in the table, regardless of their severity.
Toolbar Buttons
Item | Tooltip and shortcut | Description |
|---|---|---|
Reanalyze Dart Sources | Click this button to run the analysis of the Dart source code of the project without stopping the Dart Analysis server. | |
Restart Dart Analysis Server | Click this button to kill the Dart Analysis server and then start it. | |
Navigate with Single Click | If this button is pressed, the file that contains the selected error automatically opens in the editor, with the caret at the appropriate line. | |
Group by Severity |
| |
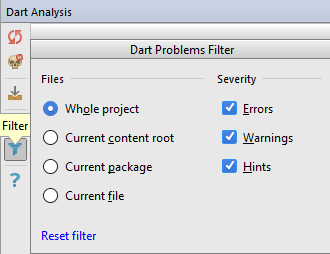
Filter | Click this button to open the Dart Problems Filter popup where you can configure the criteria according to which a problem report is displayed in the tool window or not. 
Filtering is applied immediately as soon as you change the current settings. |
Context Menu
Item | Shortcut | Description |
|---|---|---|
Jump to source | F4 | Click this button to navigate to the fragment of code that caused the selected problem. |
Copy | Ctrl+C | Take the line at caret to the clipboard. |