Code inspections
In PhpStorm, there is a set of code inspections that detect and correct abnormal code in your project. The IDE can find and highlight various problems, locate dead code, find probable bugs, spelling problems, and improve the overall code structure.
Inspections can scan your code in all project files or only in specific scopes (for example, only in production code or in modified files).
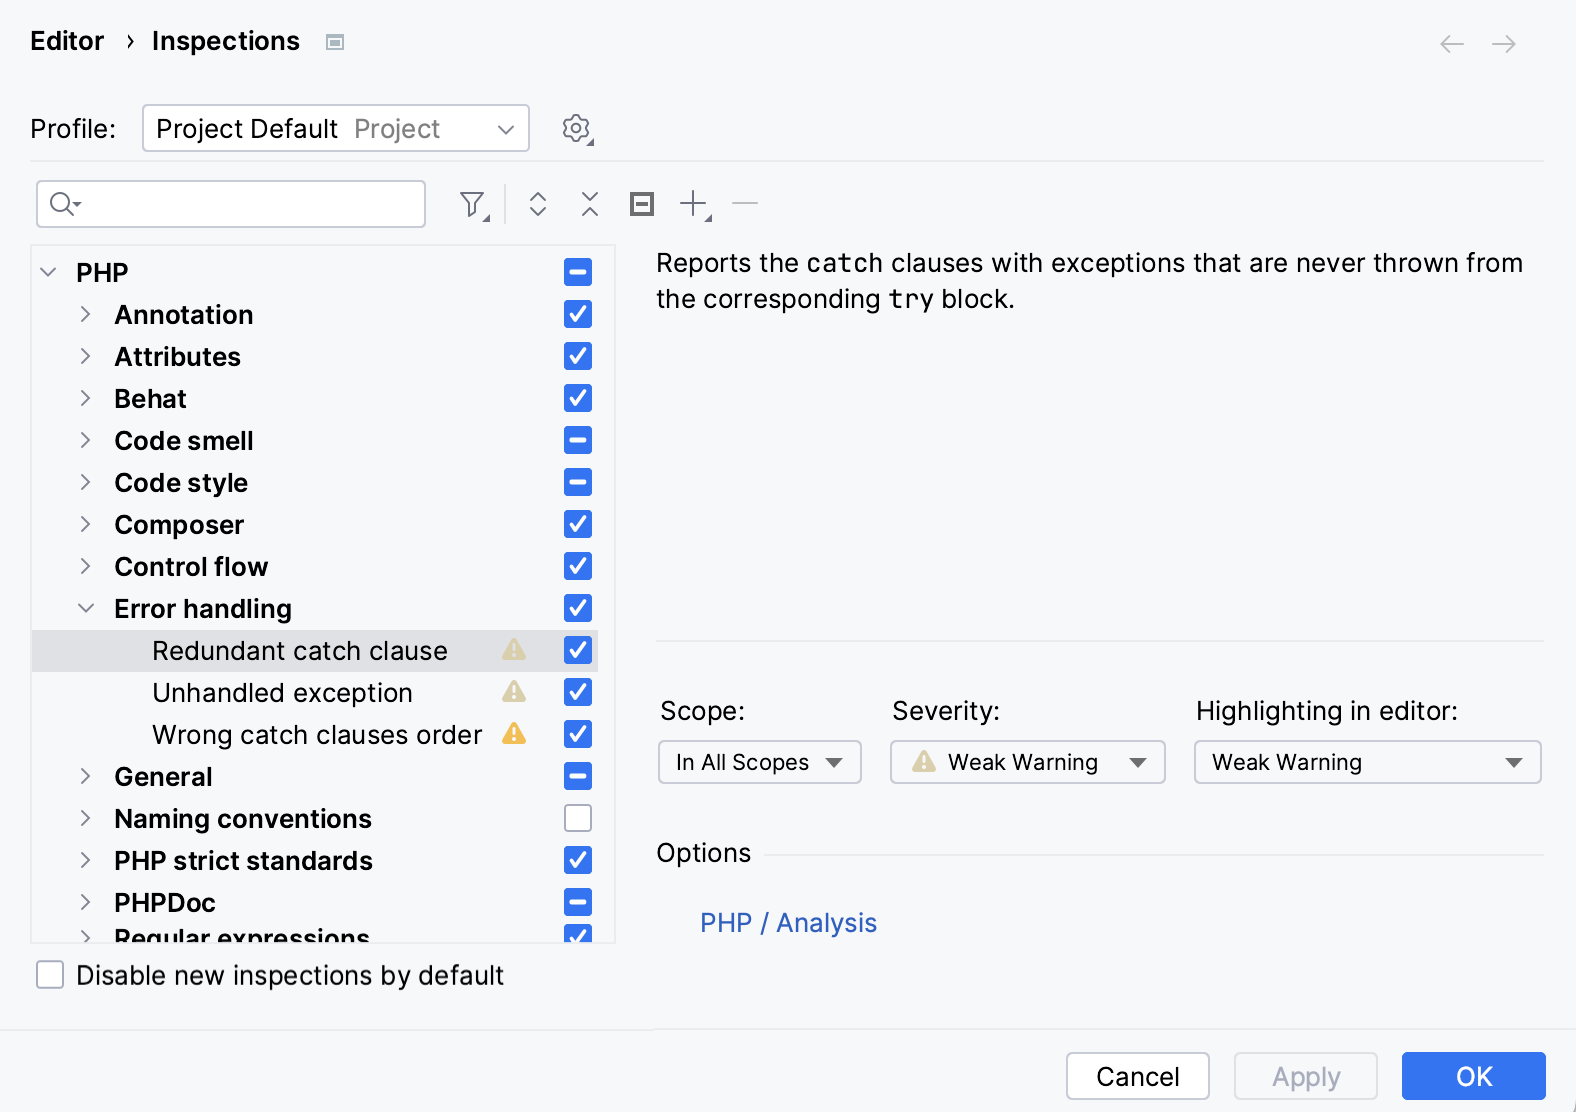
Every inspection has a severity level — the extent to which a problem can affect your code. Severities are highlighted differently in the editor so that you can quickly distinguish between critical problems and less important things. PhpStorm comes with a set of predefined severity levels and enables you to create your own.
Inspections and their settings are grouped in profiles. Each profile contains the information on the enabled inspections, a scope of files that they analyze, and their severity levels.
For the complete list of code inspections available in PhpStorm, refer to Code inspection index.
Access all available inspections and their settings
In the Settings dialog (Ctrl+Alt+S) , go to .
You can also press Ctrl+Alt+Shift+H and select Configure Inspections in the popup that opens.

Use to filter the inspection list. For example, you can filter inspections by severity or by language.
Code inspections with Qodana
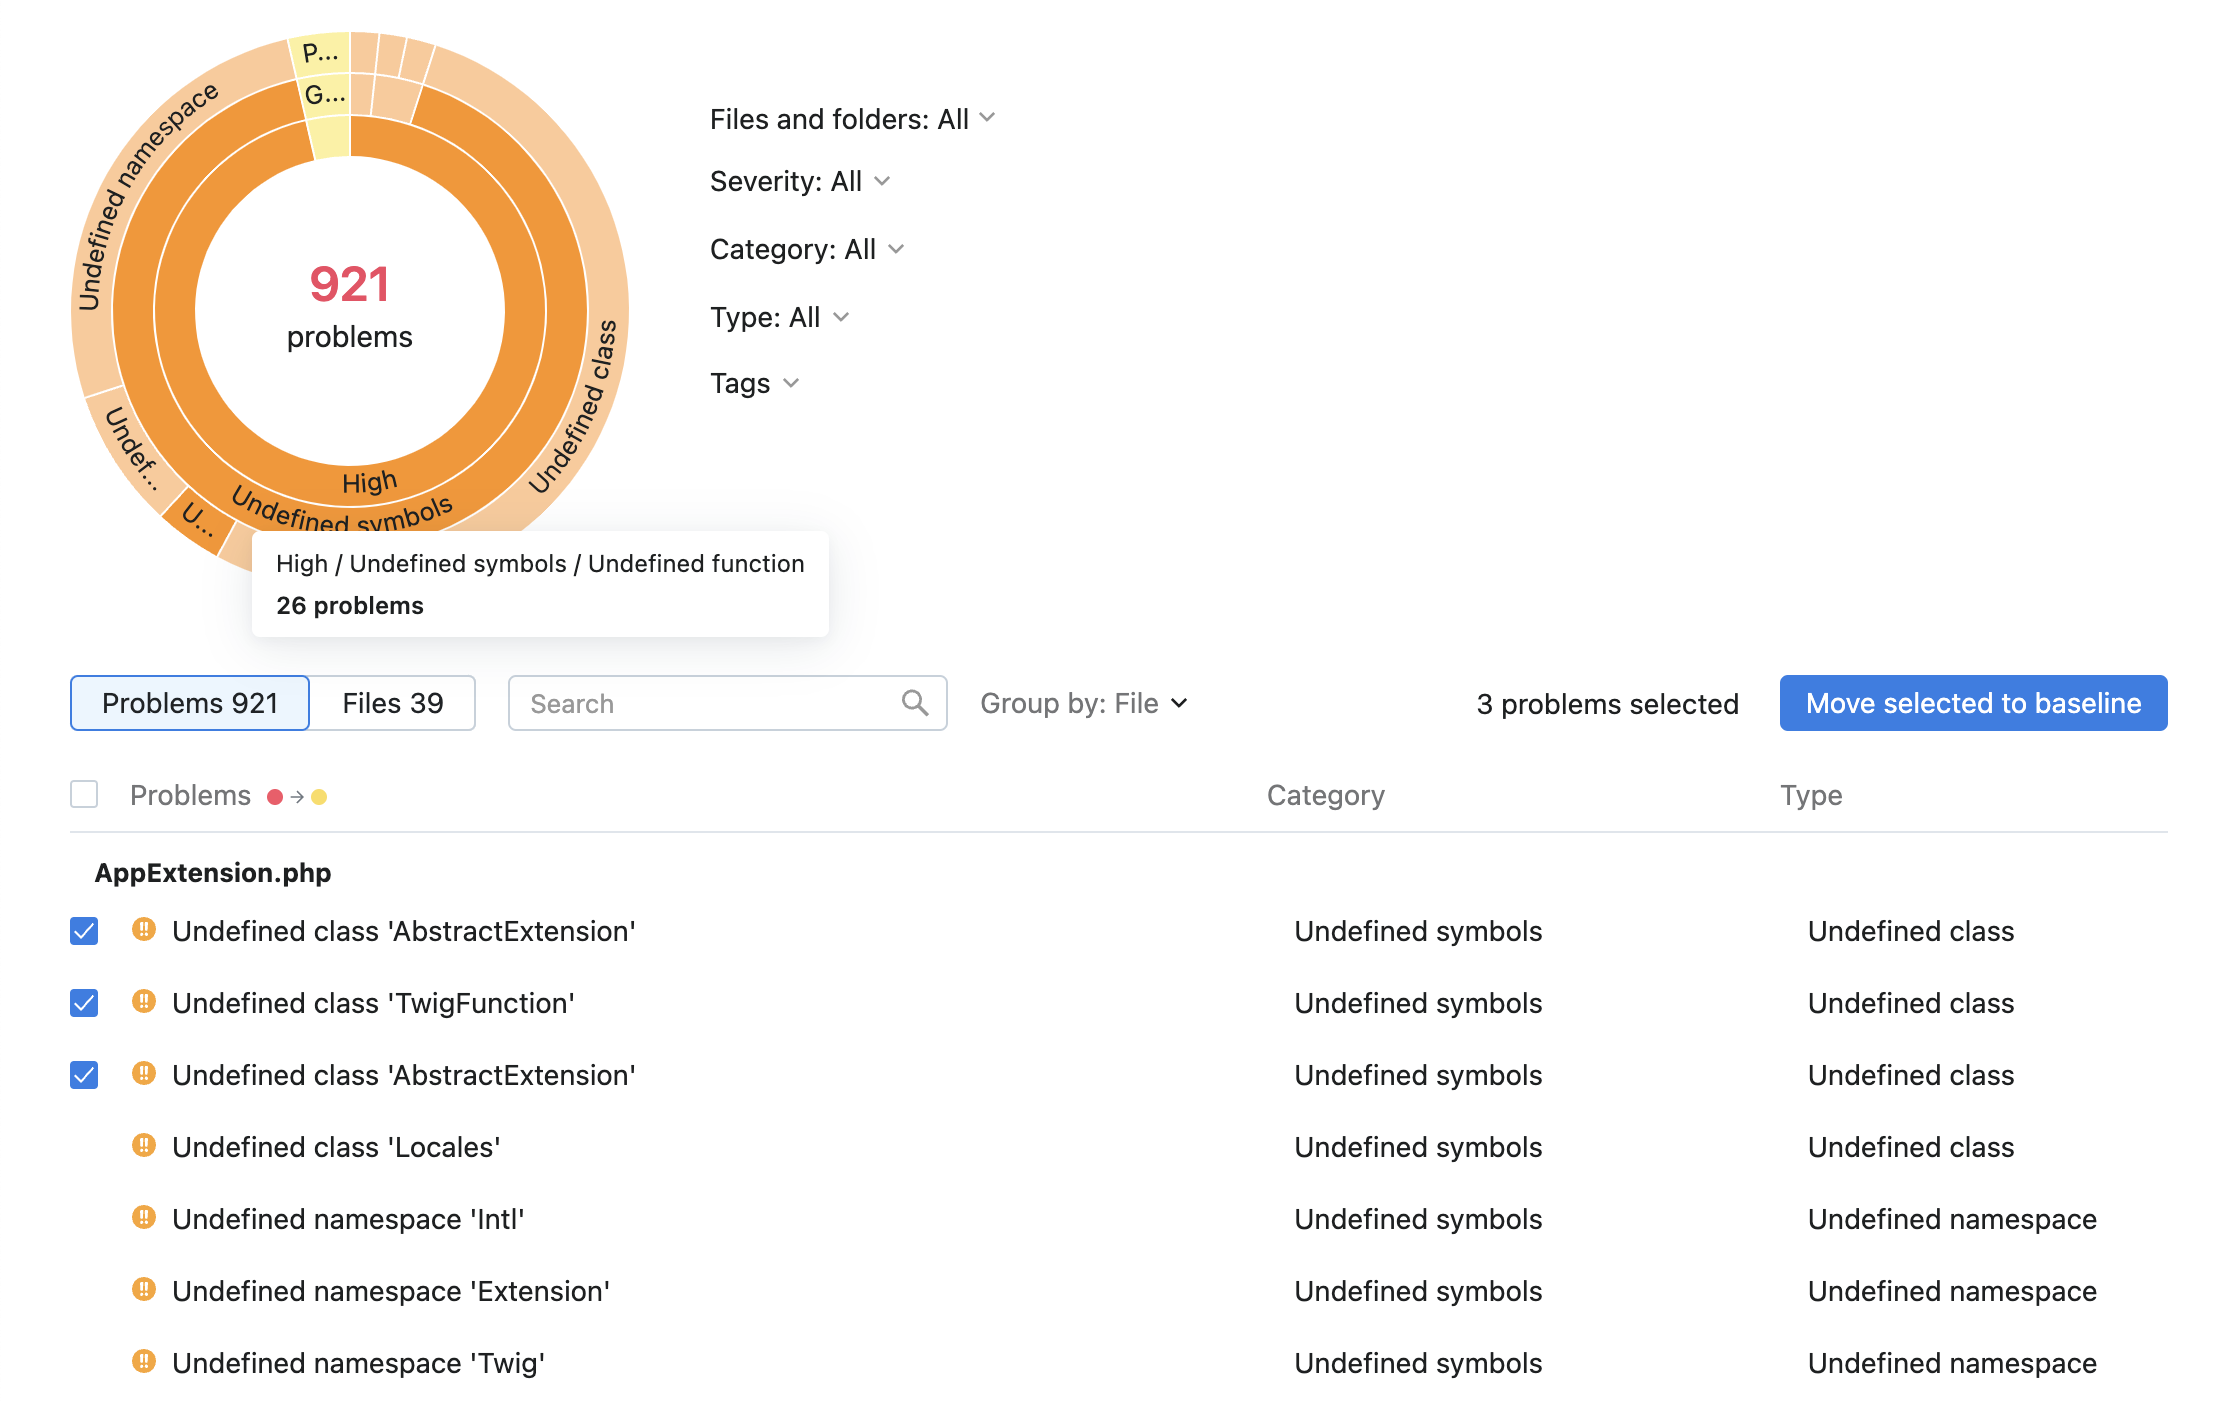
On top of running code inspections in your IDE, you can inspect your code using Qodana:
Run PhpStorm inspections locally including your IDE, and as a part of CI/CD pipelines.
Run resource-consuming inspections using your CI/CD infrastructure.
Enforce quality standards with quality gates in your CI system.
Share the same inspection profile, both within the IDE and the CI tool.
Access inspections that are available only in Qodana, such as security checks and license audits.
Access historical overviews of inspection results
You can compare inspection results between commits to better understand your progress.
For more information, refer to Qodana.
