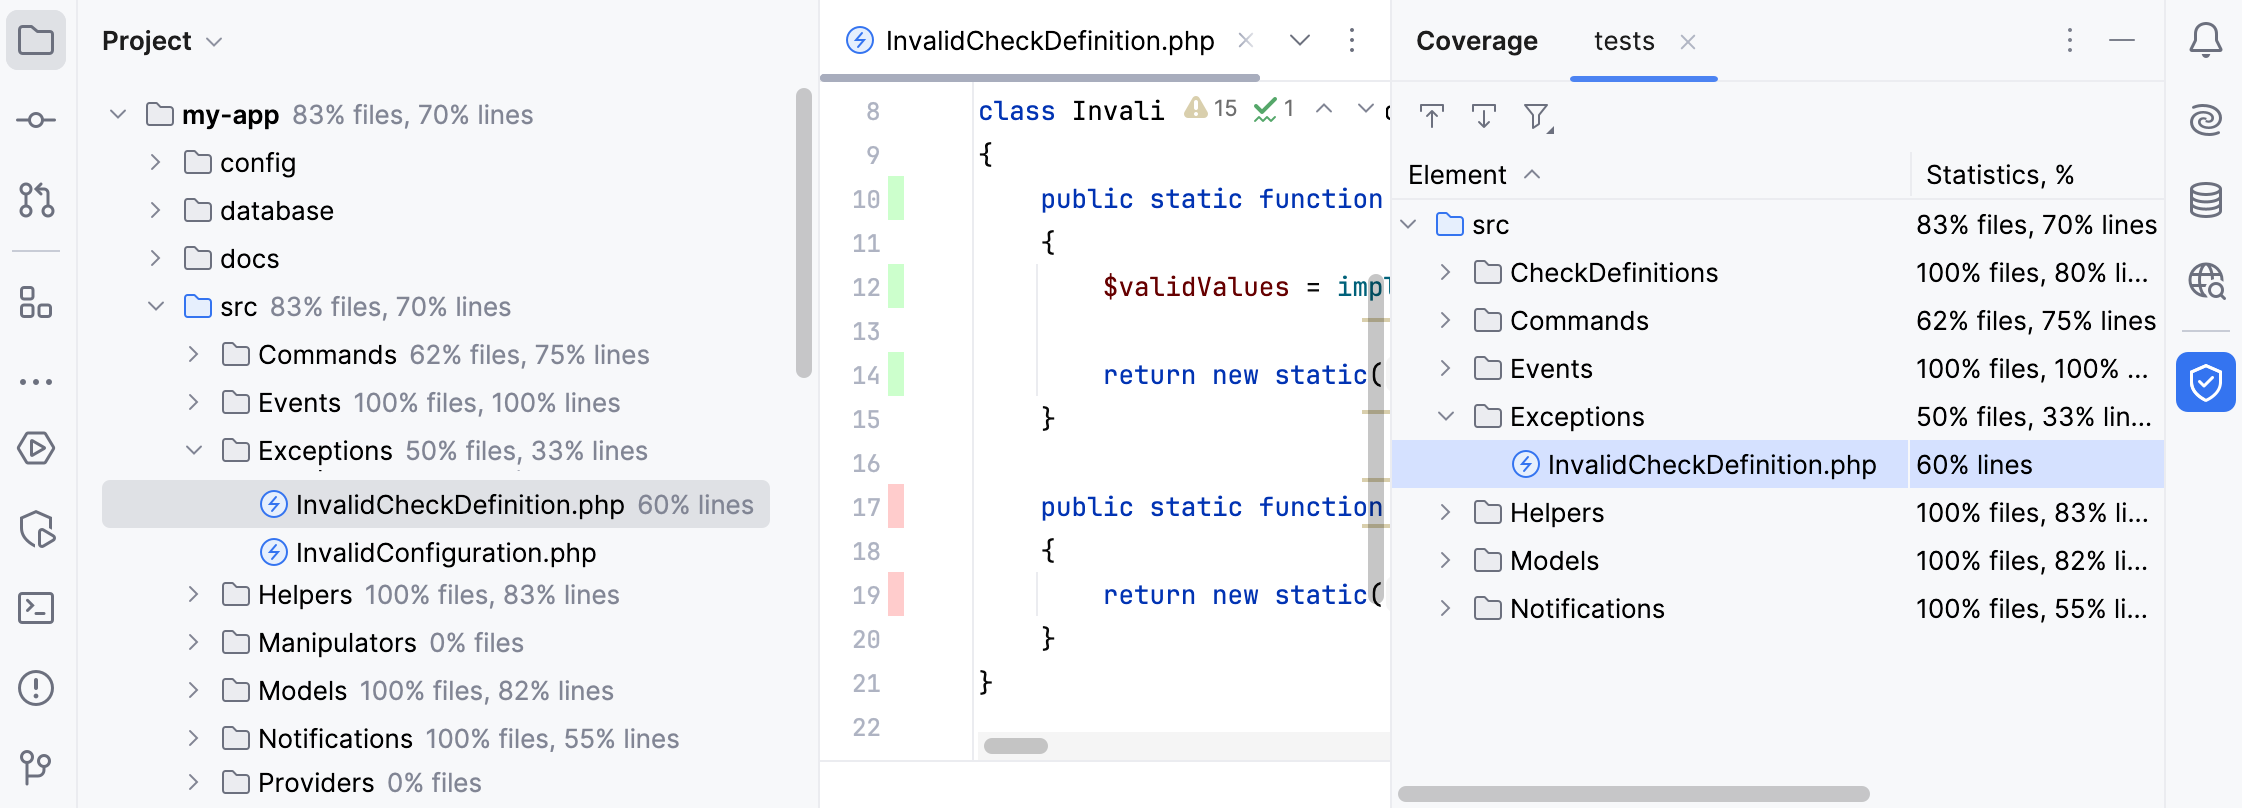
View code coverage results
Code coverage results are displayed in the Coverage tool window, in the Project tool window, and in the editor after you run at least one test configuration with coverage.

Additionally, these results are saved to the coverage folder in the IDE system directory.
Coverage tool window
The Coverage tool window opens right after you run a test configuration with coverage. The report shows:
For a directory: the percentage of the covered classes and lines.
For a file: the percentage of the covered lines.
If you want to reopen the Coverage tool window, go to in the main menu, or press Ctrl+Alt+F6.
Code coverage results in the Project tool window
The Project tool window shows:
For a directory: the percentage of the covered classes and lines.
For a file: the percentage of the covered lines.
Code coverage results in the editor
In the editor, lines of code are coloured in the gutter according to their code coverage status. To find out how many times a specific code line has been run, or hide coverage results from the editor, click its gutter color indicator.
