Change inspection severity
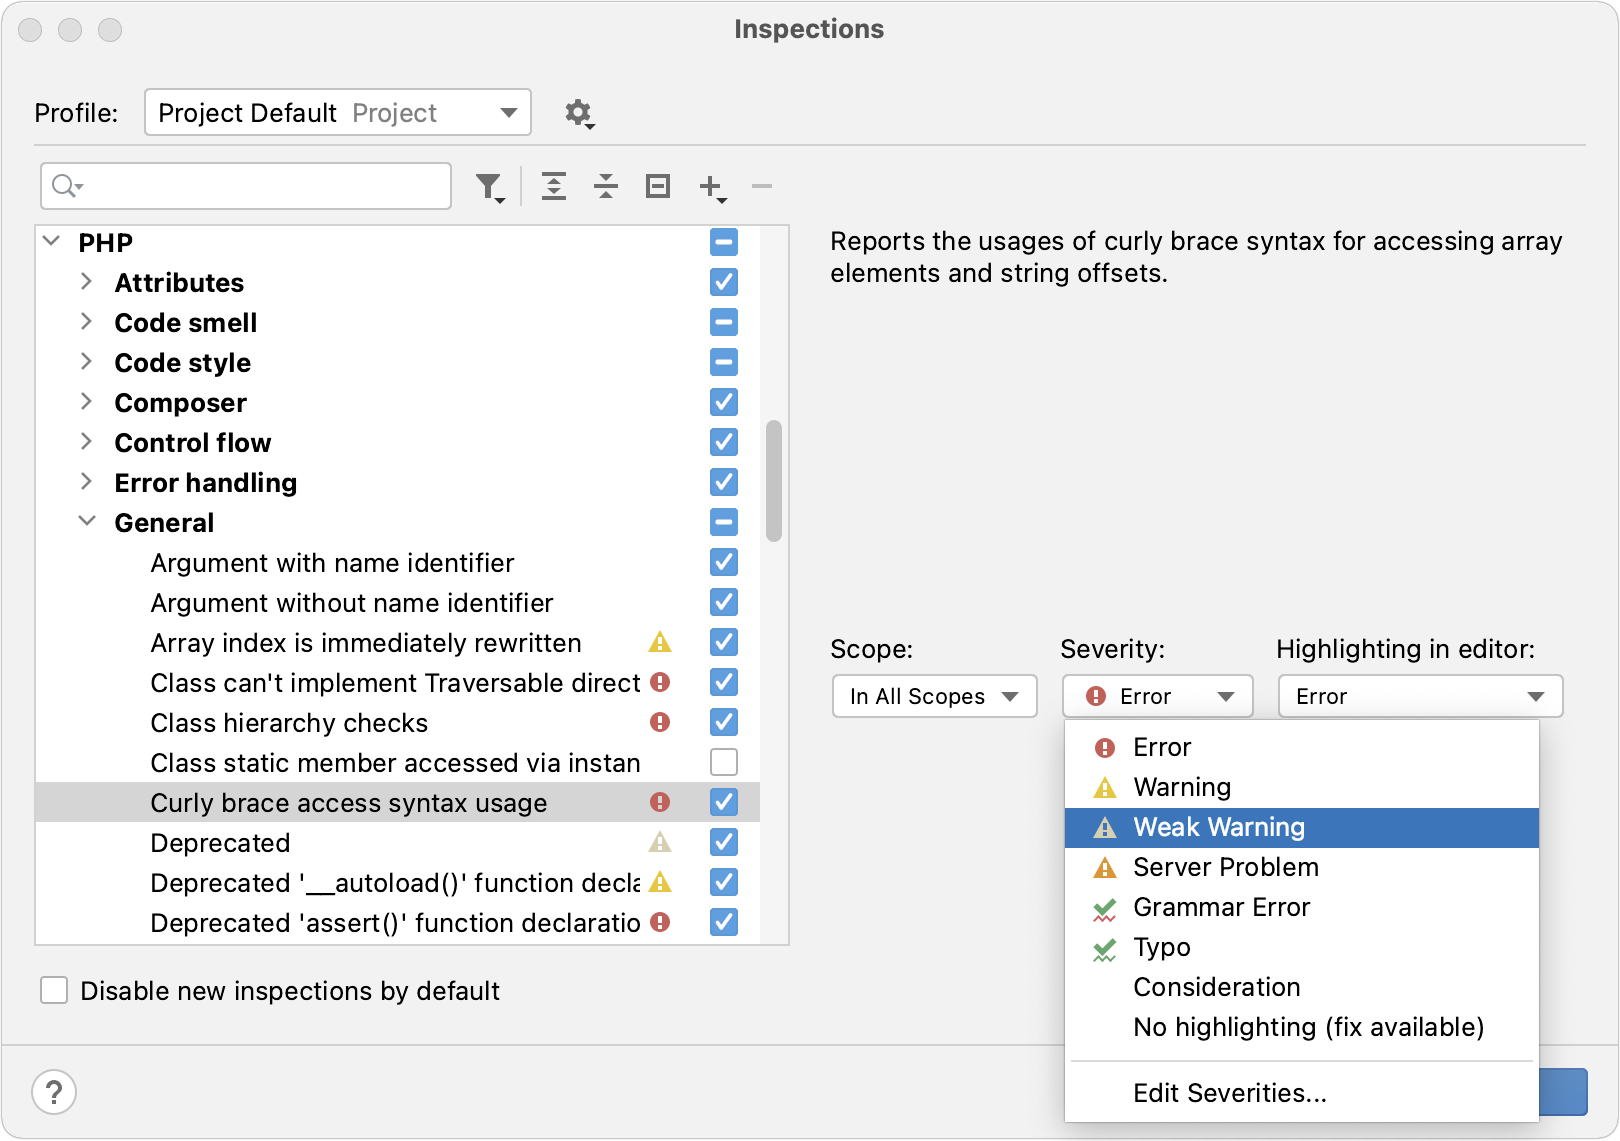
Inspection severity levels indicate how seriously the detected code problems affect your project. In PhpStorm, there is a set of predefined severity levels:
Error
Syntax errors
Warning
Code fragments that might produce bugs or require enhancement
Weak Warning
Code fragments that can be improved or optimized (redundant code, duplicated code fragments, and so on)
Server Problem
Problems that come from an external build server, for example, from TeamCity
Grammar Error
Grammar mistakes. This severity comes from the bundled Grazie Lite plugin. For more information, refer to Grammar.
Typo
Spelling mistakes and typos. For more information, refer to Spellchecking.
- Consideration
Code fragments that can be improved. This severity level is not marked on the error stripe and does not have a default highlighting style, but you can select one from the list of existing styles or configure your own.
- No highlighting (fix available)
No code highlighting, but you can invoke fixes by pressing Alt+Enter.
For every severity, you can configure its own highlighting style in the editor.
Severity levels are designed to indicate problems, they don't have any impact on the code execution: if you change the severity for spelling mistakes from Typo to Error, this won't affect the execution of your application.
Change inspection severity in all scopes
Press Ctrl+Alt+S to open settings and then select .
Select the profile that you want to modify and then choose an inspection from the list. Make sure that it is enabled.
From the Severity list, select a new severity level. You can also right-click the inspection and select the severity level from the context menu.
If the necessary severity is not on the list, click Edit Severities to create a new one.
From the Highlighting in editor list, select the style that you want to use to highlight code fragments in the editor.
Select Edit Highlighting to modify the existing styles.

Apply the changes and close the dialog.
The modified inspection will now have the new severity level in the selected profile.
Change inspection severity in specific scopes
Press Ctrl+Alt+S to open settings and then select .
Select the profile that you want to modify and then choose an inspection from the list. Make sure that it is enabled.
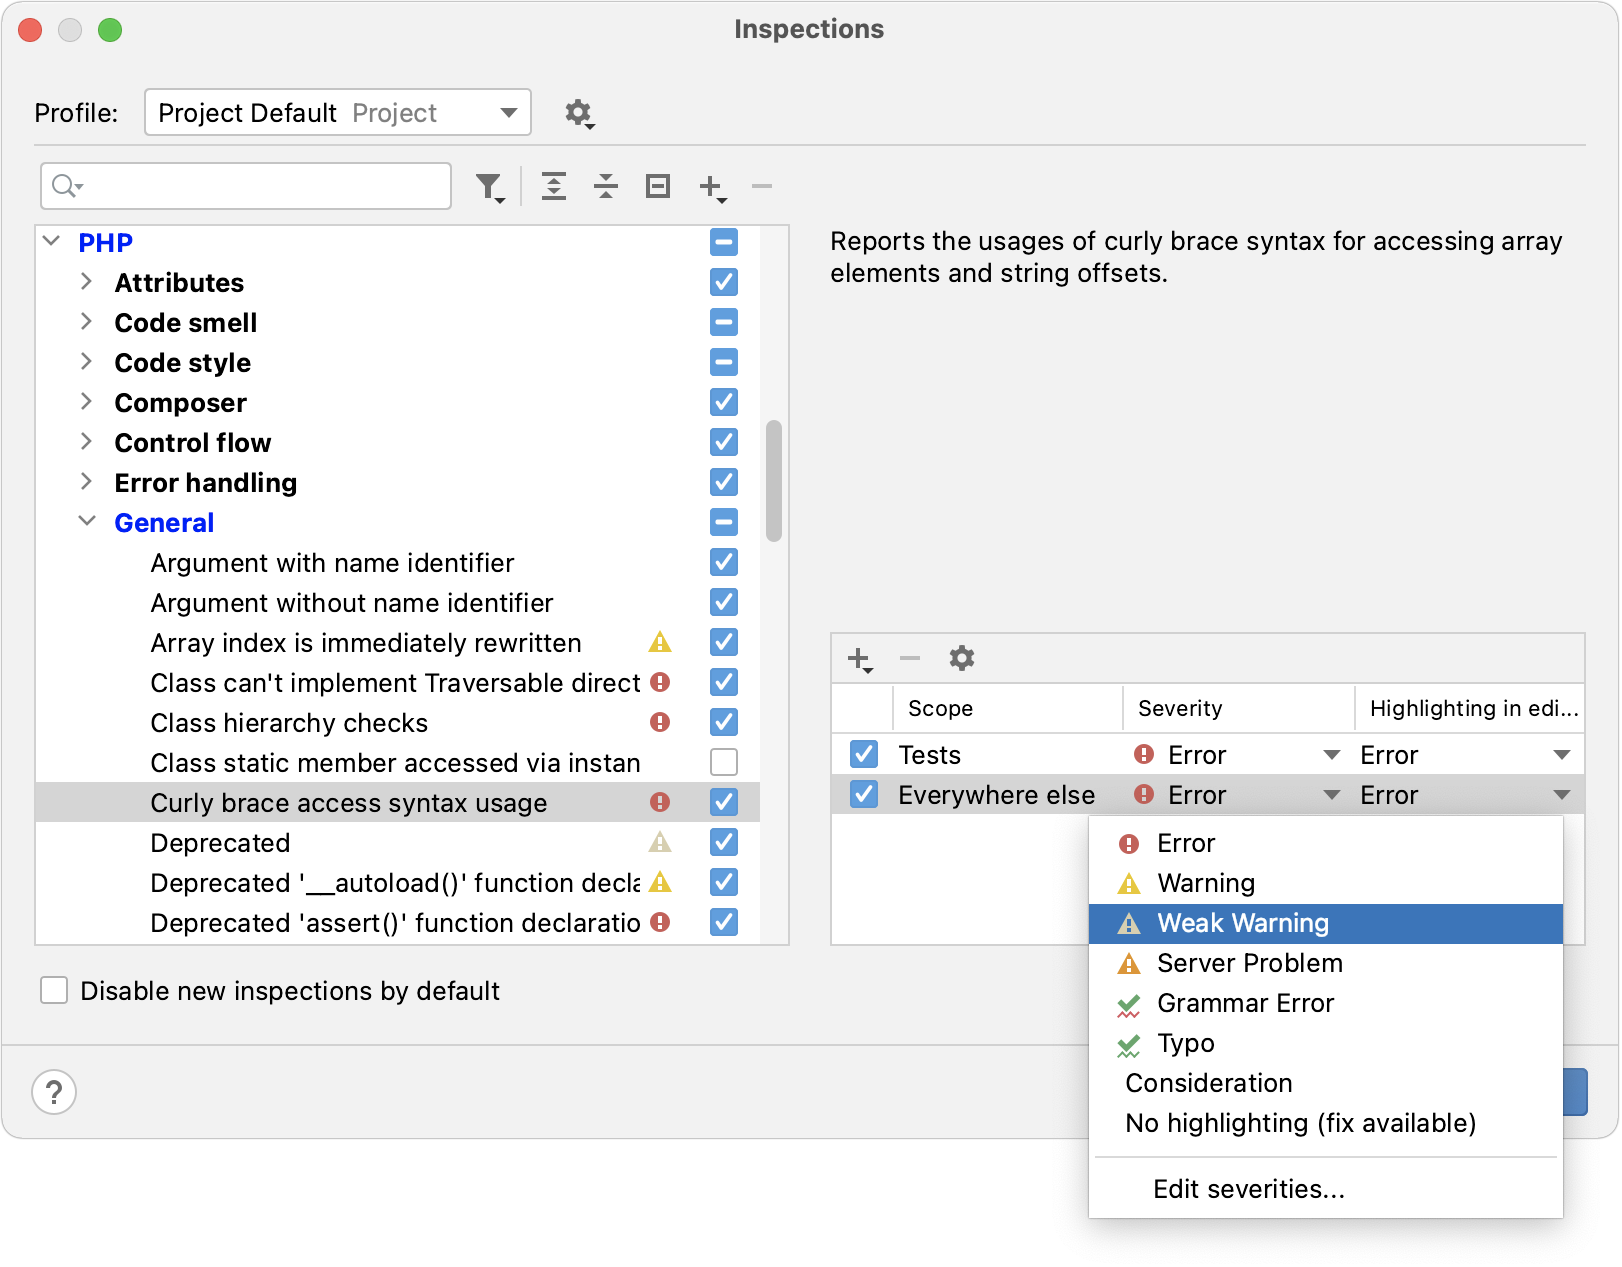
From the Scope list, select the scope for which you want to change the severity.
PhpStorm shows severities for two scopes: the selected one and Everywhere else.
To add one more scope, click
. If you want to create a new scope, select Edit Scopes Order from the list of scopes and click
.
Select the necessary severity level from the Severity list.
If the necessary severity is not on the list, click Edit Severities to create a new one.

Additionally, from the Highlighting in editor list, select the style that you want to use to highlight code fragments in the editor.
Select Edit Highlighting to modify the existing styles.
If you enable an inspection in multiple scopes, and files in these scopes match, the IDE will process these scopes according to their order in the list. For more information, refer to Change the order of scopes.
Configure error highlighting
Press Ctrl+Alt+S to open the IDE settings and select .
You can also configure highlighting from inspection settings: go to , click any enabled inspection, and from the Highlighting in editor list, select Edit Highlighting.
From the Errors and Warnings list, select the style that you want to modify.
Configure the new highlighting rules using the options on the right. To preview the changes before applying them, use the preview section at the bottom of the dialog.

Create a new severity level
Press Ctrl+Alt+S to open settings and then select .
Select the profile in which you want to create a new severity level.
Click any inspection and select Edit severities from the list of severity levels.
In the Severities Editor dialog, click
and name the new severity level.
Configure the formatting and set a priority using the
and
buttons — the higher you put the severity on the list, the higher its priority.
Click OK when finished.

Customizing inspections for Undefined elements
In the PHP context, the Undefined field and Undefined method inspections may erroneously report severe problems when actually no problems take place. This happens when you attempt to access or assign a value to a property, or to call a method that is not explicitly defined, while the referenced class contains the __get(), __set(), or __call() magic methods. No errors should be reported in such cases because these methods are invoked every time an undefined property or method is referenced, however, PhpStorm still treats them as errors or warnings, depending on the severity level you have specified for the inspection.
Suppress reporting for Undefined field errors
In the Settings dialog (Ctrl+Alt+S) , go to .
Select the Undefined field inspection in the list.
In the Options area, clear the Notify about access to a field via magic method and Notify about PHP dynamic field declaration checkboxes.
When the checkboxes are selected, PhpStorm reports errors even if the class contains the __get() and __set() magic methods.
Adjust reporting for Undefined method errors
In the Settings dialog (Ctrl+Alt+S) , go to .
Select the Undefined method inspection in the list.
In the Options area, select the Downgrade severity if __magic methods are present in class checkbox.
Undefined methods will now be indicated with the severity level that is one step lower than specified for inspections in general (by default, Info instead of Warning).
Configure reporting for Undefined variable errors
In the Settings dialog (Ctrl+Alt+S) , go to .
Select the Undefined field inspection in the list.
In the Options area, configure the inspection as follows:
Enable inspection in global space: select this checkbox to run the inspection against variables outside functions/methods, classes, and namespaces, that is, in the global space.

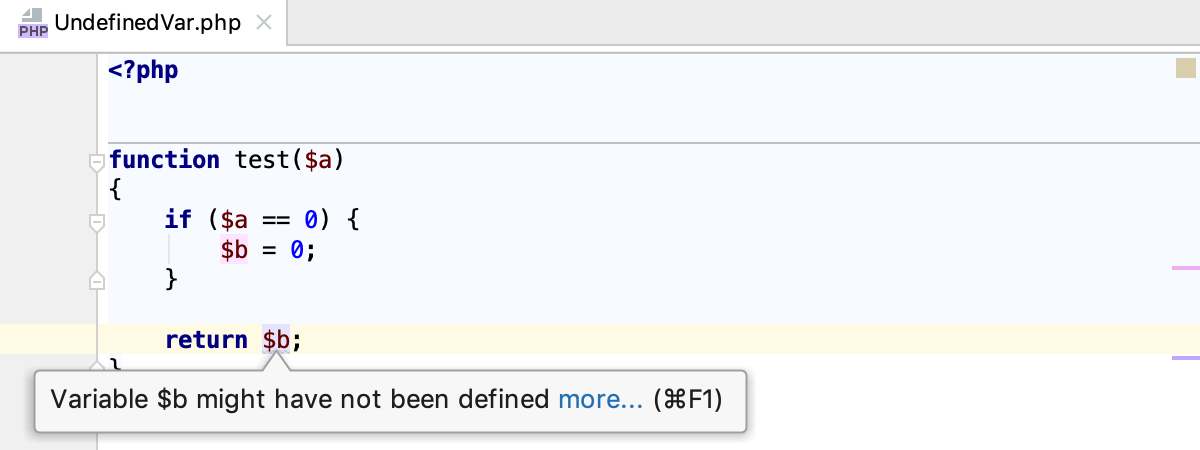
Report that variable might have not been defined: select this checkbox to have an error reported even if the definition of a variable is not definitely missing. Such situation may take place when a variable is used in several paths and some of them may never be reached, for example, in
if()statements:
Search for variable's definition outside the current file: if selected, the IDE reports a global variable as undefined only in case there are no
includeorrequirestatements in the current file and the variable's definition cannot be found in the project.Otherwise, if not selected, the IDE searches for the variable's definition only in the current file and ignores the
includeorrequirestatements if any.