Debug PHP and JavaScript code at the same time
Web applications typically consist of both PHP and JavaScript code: PHP code runs on the server side, while JavaScript runs in the browser. With PhpStorm, you can easily debug the PHP code to inspect what is happening on the server, modify variables, and so on. We can also debug the JavaScript running in the browser by starting a JavaScript debugging session from the IDE.
This tutorial provides an overview of how you can debug PHP and JavaScript code simultaneously from within PhpStorm.
Before you start
PhpStorm supports debugging with two most popular tools: Xdebug and Zend Debugger. These tools cannot be used simultaneously because they block each other. To avoid this problem, you need to update the php.ini file of the relevant PHP interpreter as described in Configure Xdebug and Configure Zend Debugger.
Open the active php.ini file in the editor:
In the Settings dialog (Ctrl+Alt+S) , click PHP.
On the PHP page that opens, click
next to the CLI Interpreter field.
In the CLI Interpreters dialog that opens, the Configuration file read-only field shows the path to the active php.ini file. Click Open in Editor.
Next, install PhpStorm debugging bookmarklets or one of the Browser debugging extensions.
Listening for incoming debugger connections
In PhpStorm, enable listening to incoming debug connections by doing any of the following:
Click
on the toolbar/the status bar.
Select in the main menu.
This ensures that PhpStorm reacts when a debugging session is started on the web server and opens the Debug tool window automatically. Before starting a debugging session, make sure that either a breakpoint is set or the Break at first line in PHP scripts option is enabled on the Debug page of the Settings dialog Ctrl+Alt+S.
Start the JavaScript debugger
Depending on your preference or application requirements, you can use the PhpStorm's built-in webserver to run our application locally, or make use of any other web server running either locally or on a remote machine.
Use the built-in web server
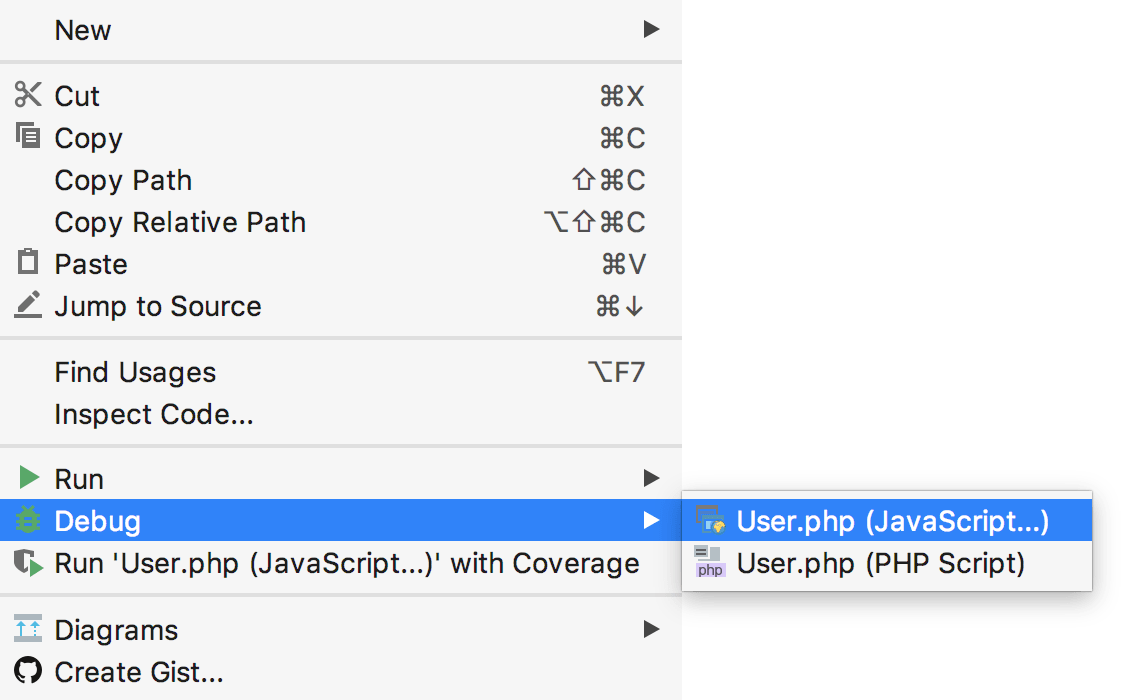
The JavaScript debugger in PhpStorm can be started from the editor or from the Project tool window by means of the context menu command. If the selected file is a PHP file, two entries will be available. It is important to select the first one marked with , which will start the JavaScript debugger.

Once started, we can place breakpoints in JavaScript code and use the JavaScript debugger.
Use an external web server
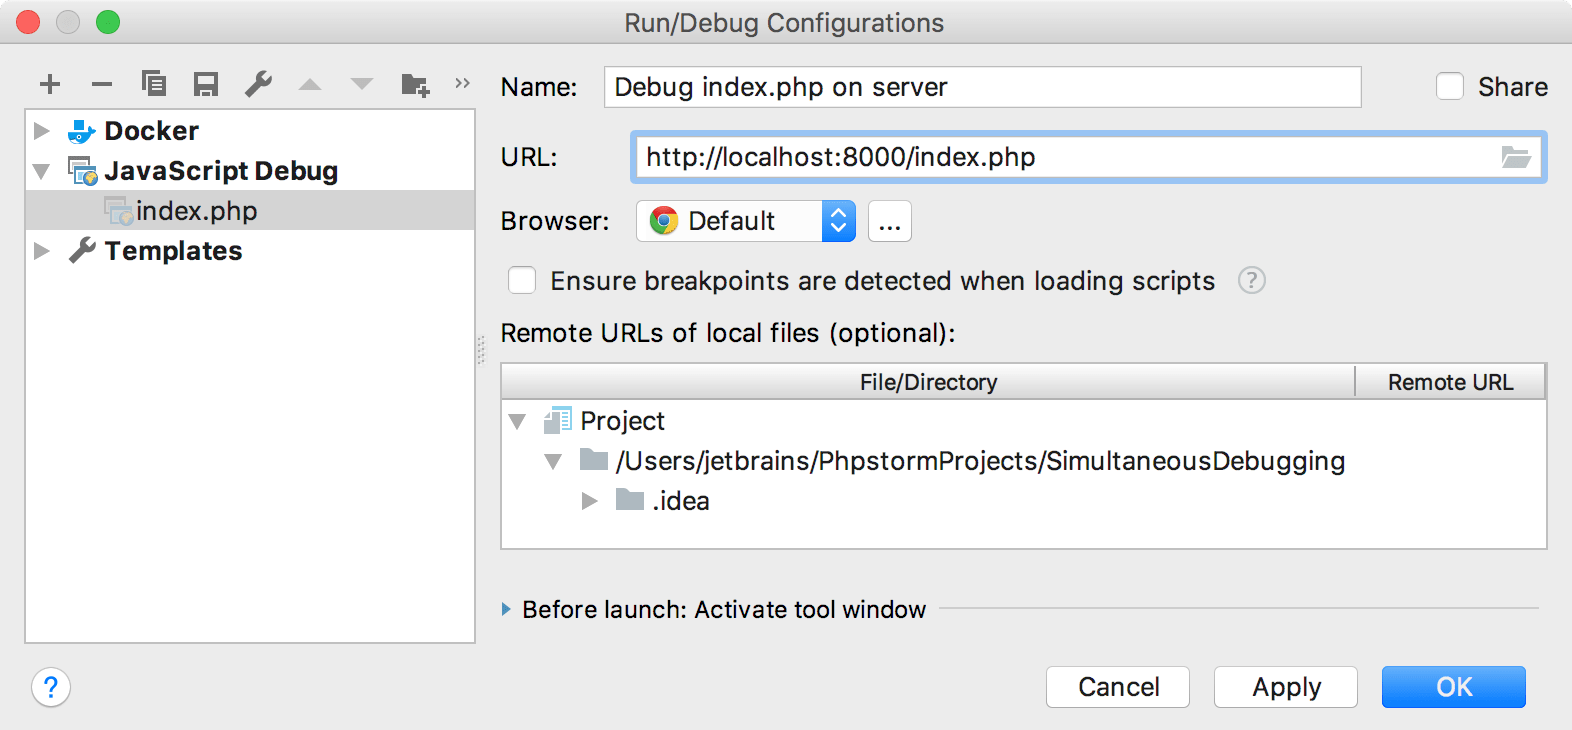
When using a local web server, such as Apache or Nginx, or when developing on a remote web server, a Vagrant or a Docker machine, we can start the JavaScript debugger using a run/debug configuration.
Create a Run/Debug configuration
Do any of the following:
Select Edit Configurations on the PhpStorm toolbar
Select from the main menu.
In the Run/debug configurations dialog dialog that opens, click
on the toolbar and add a new JavaScript Debug configuration.
Enter the full URL to the page we want to debug on the web server. Optionally, provide some mappings so PhpStorm can determine where to find local files relative to the remote URL. This is only required when we have a different project structure locally and on the remote server. Note that if you are deploying PHP applications with PhpStorm, mappings will be reused from the deployment configuration.

Once the configuration is created, you can start the JavaScript debugging session from the PhpStorm toolbar:
![]()
Start a PHP debugging session from the browser
We'll follow the Zero-configuration debugging approach. In the browser, we can use PhpStorm debugging bookmarklets or one of the Browser debugging extensions to start a PHP debugging session. This will instruct the PHP server to make a connection to PhpStorm and open the debugger. Note that the IDE may initially ask you to provide the necessary path mappings. Once the debugger is attached, we will be able to debug both JavaScript and PHP at the same time. PhpStorm will switch between the debuggers as necessary.
Launch the JavaScript and PHP debugger at the same time
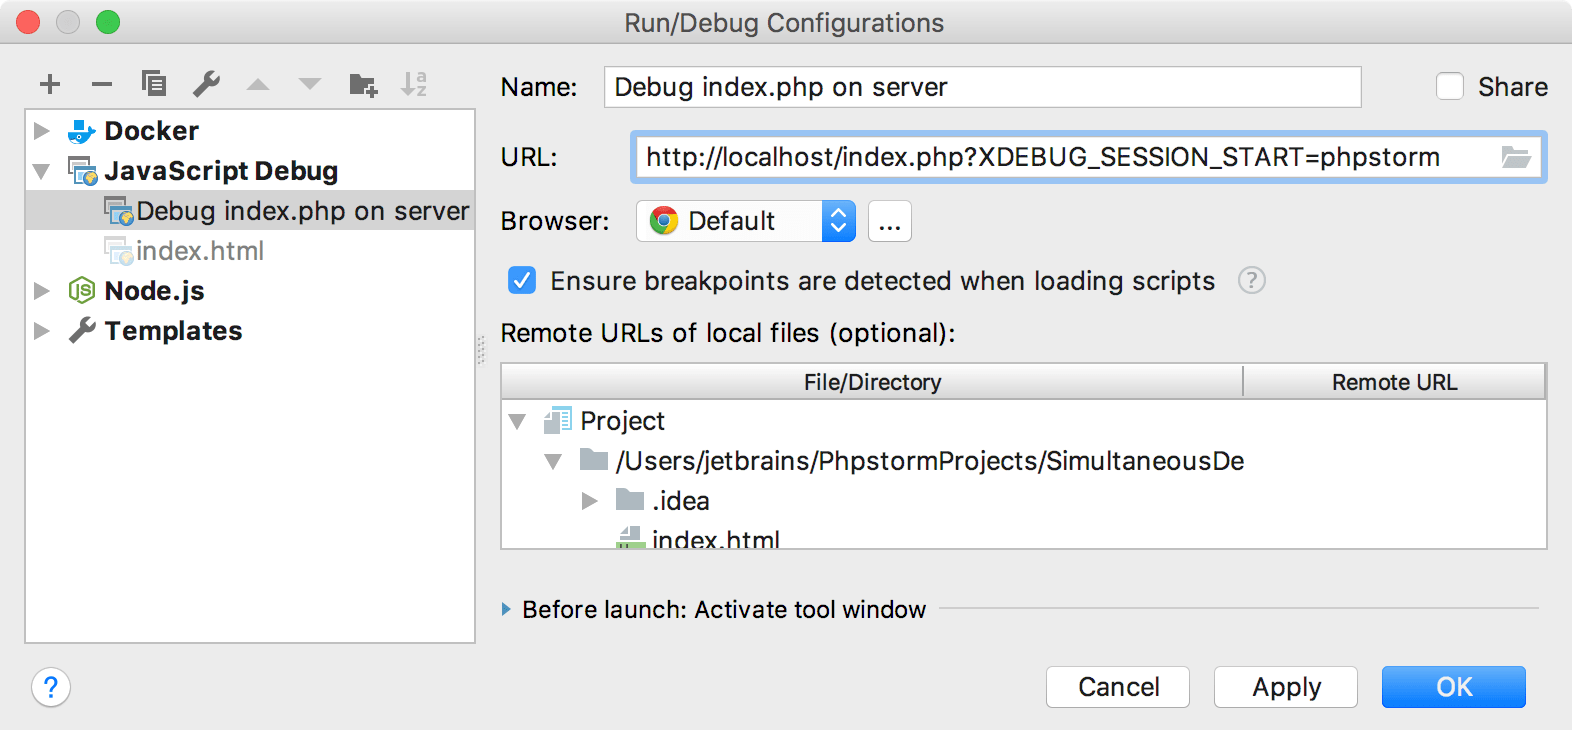
In the previous steps, we started the JavaScript and PHP debugger separately. When using Xdebug, we can pass a XDEBUG_SESSION_START URL parameter to our server to start PHP debugging simultaneously with JavaScript debugging. We can do this using a customized run/debug configuration. Create the run/debug configuration as you've done earlier, and make sure to append the XDEBUG_SESSION_START=some-session-name URL parameter, for example, ?XDEBUG_SESSION_START=phpstorm:

Troubleshooting
I cannot place breakpoints in the JavaScript parts of a php file
Currently, setting both PHP and JavaScript breakpoints in one file is not supported. For example, no JavaScript breakpoints can be set in the following code:
To be able to debug the PHP and JavaScript code simultaneously, move the JavaScript code into a separate .js file and reference it from HTML:
We can then place PHP breakpoints in the php file, and set JavaScript breakpoints in the js file.