Profiling with Xdebug
Besides interactive debugging, the IDE's integration with Xdebug also supports profiling. PhpStorm provides visual representation of the profiling snapshots generated by Xdebug to help you examine how your PHP application uses execution time and memory.
Set up profiling with Xdebug
Set up Xdebug
Configure Xdebug profiler in php.ini
Open the active php.ini file in the editor:
In the Settings dialog (Ctrl+Alt+S) , click PHP.
On the PHP page that opens, click
next to the CLI Interpreter field.
In the CLI Interpreters dialog that opens, the Configuration file read-only field shows the path to the active php.ini file. Click Open in Editor.
Enable the Xdebug profiler mode by one of the following ways:
To permanently enable the profiler, set the
xdebug.mode(for Xdebug 3) orxdebug.profiler_enable(for Xdebug 2) setting toprofile:xdebug.mode = profilexdebug.profiler_enable = 1To enable triggering the profiler from the browser by using the XDEBUG_PROFILE cookie or a GET/POST parameter, set the following settings depending on the Xdebug version used:
xdebug.mode = profile xdebug.start_with_request = triggerxdebug.profiler_enable = 0 xdebug.profiler_enable_trigger = 1
Specify the location for storing profiling snapshots:
Add the
xdebug.output_dir(Xdebug 3) orxdebug.profiler_output_dir(Xdebug 2) setting and specify the path to the directory as its value.xdebug.output_dir = <path to output folder>xdebug.profiler_output_dir = <path to output folder>Add the
xdebug.profiler_output_namesetting and specify the name of the file to store snapshots in as its value.The default value is
cachegrind.out.%p, where%pis the name format specifier. Use the default value or define a custom file format according to the supported format specifiers. Note that the name should always be cachegrind.out.xdebug.profiler_output_name = cachegrind.out.%p
Configure toggling the profiler from the browser
To specify the XDEBUG_PROFILE cookie or a GET/POST parameter, do one of the following:
Generate the bookmarklets to toggle the debugger through. These bookmarklets will appear on the toolbar of your browser. They provide control over the debugger cookie, through them you will activate and deactivate the debugger.
Enable the Bookmarks toolbar in your browser by doing one of the following depending on the browser type:
In Firefox, choose .
In Chrome, choose .
Open the Xdebug & Zend Debugger bookmarklets generator page, check the debugging engine settings and click Generate. The bookmarks for listed debugging-related actions are generated.
Drag the generated links to the bookmark toolbar in your browser.
Initiate an Xdebug debugging session to collect profiling data
Do one of the following:
To start debugging an entire application, create debug configuration of the type PHP Web Page, and launch debugging by clicking
.
For more information, refer to Debug with a PHP web page debug configuration.
To debug a specific PHP HTTP request, define a debug configuration of the type PHP HTTP Request, and launch debugging by clicking
.
For more information, refer to Debug a PHP HTTP request.
To initiate a zero-configuration debugging session:
Toggle the Start Listen PHP Debug Connections button
on the PhpStorm toolbar or status bar so that it changes to
. After that PhpStorm starts listening to the port of the debugging engine used in the current project. Debugging ports are set at the PhpStorm level on the PHP | Debug page of the Settings dialog (Ctrl+Alt+S) .
Open the starting page of your application in the browser, choose the Start debugger bookmark to activate the debugging engine from the browser, re-load the current page (the starting page of the application), and then return to PhpStorm.
Profile PHP CLI scripts
You can generate profiler snapshots for PHP CLI scripts in PhpStorm without setting Xdebug to the profile mode in php.ini and initiating an Xdebug debugging session.
To generate a profiler snapshot for a PHP script:
Set up Xdebug in PhpStorm.
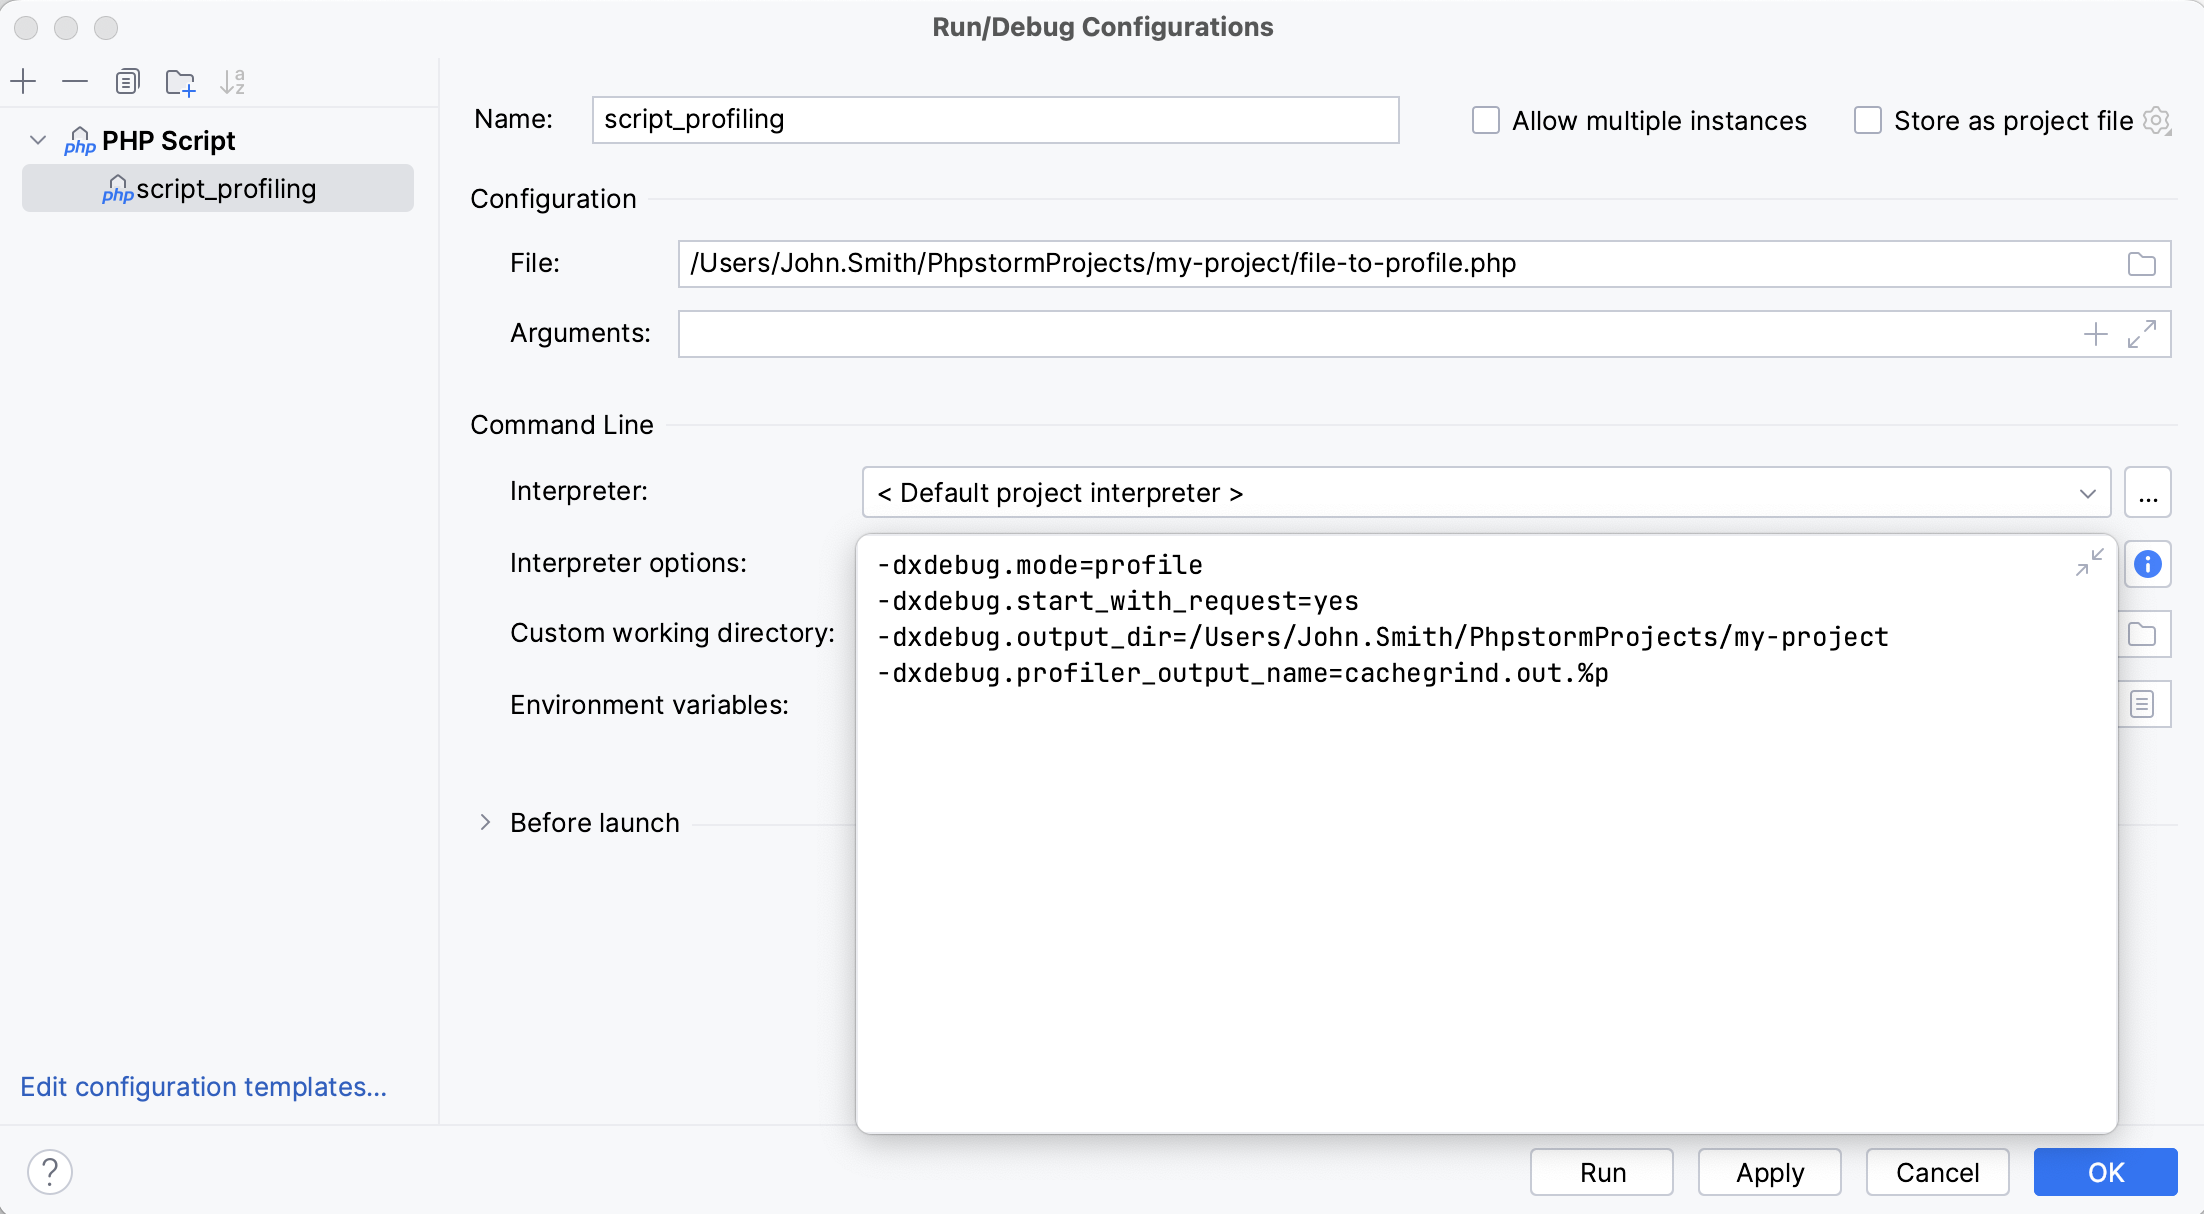
Create a custom run configuration for the PHP script file and specify the following Interpreter options in it:
-dxdebug.mode=profile -dxdebug.start_with_request=yes -dxdebug.output_dir=/Users/{username}/{path-to-project-directory} -dxdebug.profiler_output_name=cachegrind.out.%p
Launch the created run configuration by clicking Run from the Run/Debug Configurations dialog or using your preferred way of running application configurations.
Every time you launch such run configuration, PhpStorm generates a
cachegrind.out.%pprofiler snapshot and stores it in the specified output folder.
Analyze Xdebug profiling data
Retrieve the data accumulated by the profiler
In the main menu, go to .
In the Select Xdebug profiler snapshot dialog that opens, choose the folder and the file where the profiling data is stored.
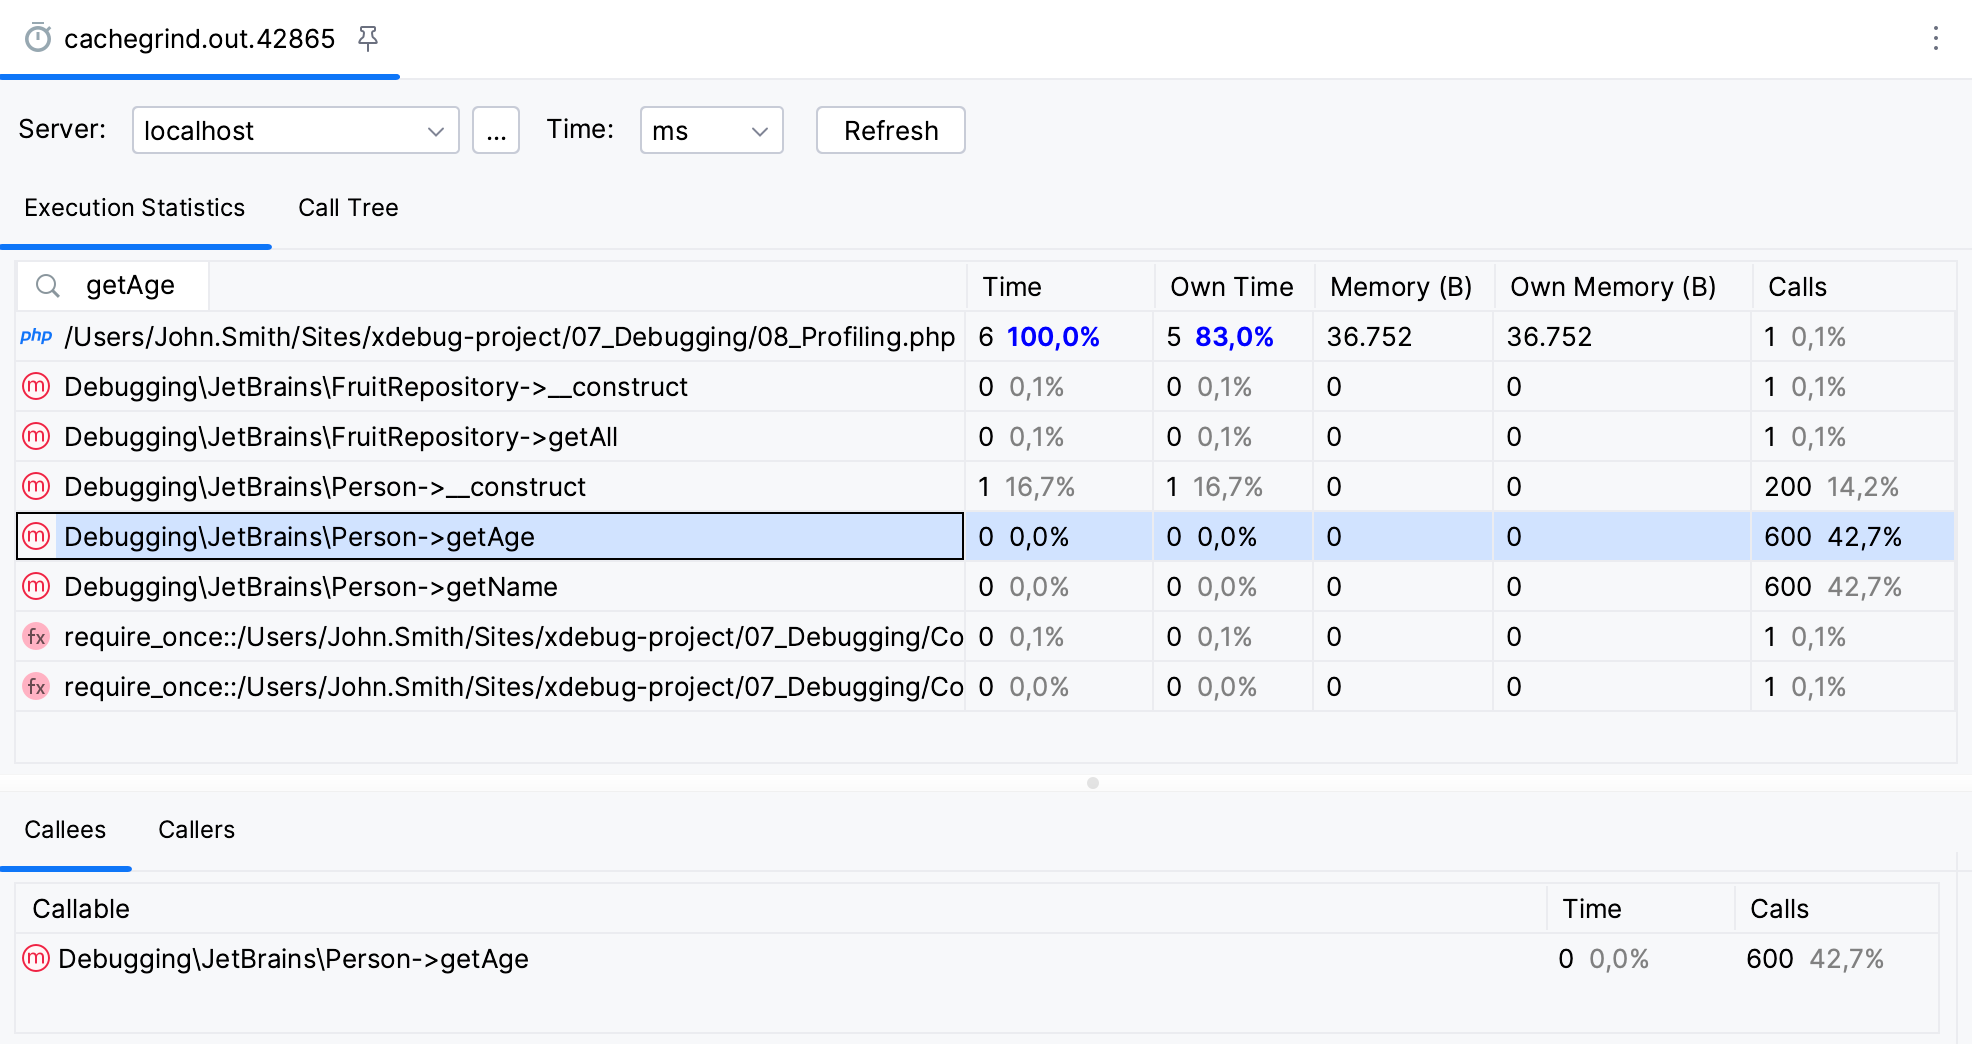
PhpStorm presents the collected profiling data in a separate editor tab with the name of the selected profiler output file.

You can select and open several snapshots at a time. In this case, PhpStorm aggregates the profiling data from all the selected snapshots and presents the averaged result in a single tab.
Examine the profiling data
Switch between the tabs to analyze the profiling data. To quickly find a specific function in a tab, use speed search.
Execution Statistics: use this tab to examine the summary information about execution metrics of every called function.
Call Tree: use this tab to explore the execution paths of all called functions.
Callees: use this tab to explore the execution paths of a specific function selected in the Call Tree tab.
Callers: use this tab to explore all the paths that can result in calling a specific function selected in the Call Tree tab.
Metric name | Description |
|---|---|
Time | The amount of time (in percent) spent in the selected function and all the functions that are recalled from this function. |
Own time | The amount of time (in percent) spent in the selected function, discounting the amount of time spent in the functions that are recalled from this function. |
Memory (B) | The amount of memory (in bytes) consumed by the selected function and all the functions that are recalled from this function. |
Own memory (B) | The amount of memory (in bytes) consumed by the selected function, discounting the amount of memory consumed by the functions that are recalled from this function. |
Calls | The number of times the selected function was called. |