View data
When you double-click a table in the Database tool window ( ), the table, view, or virtual view opens in the data editor tab.
Data view modes
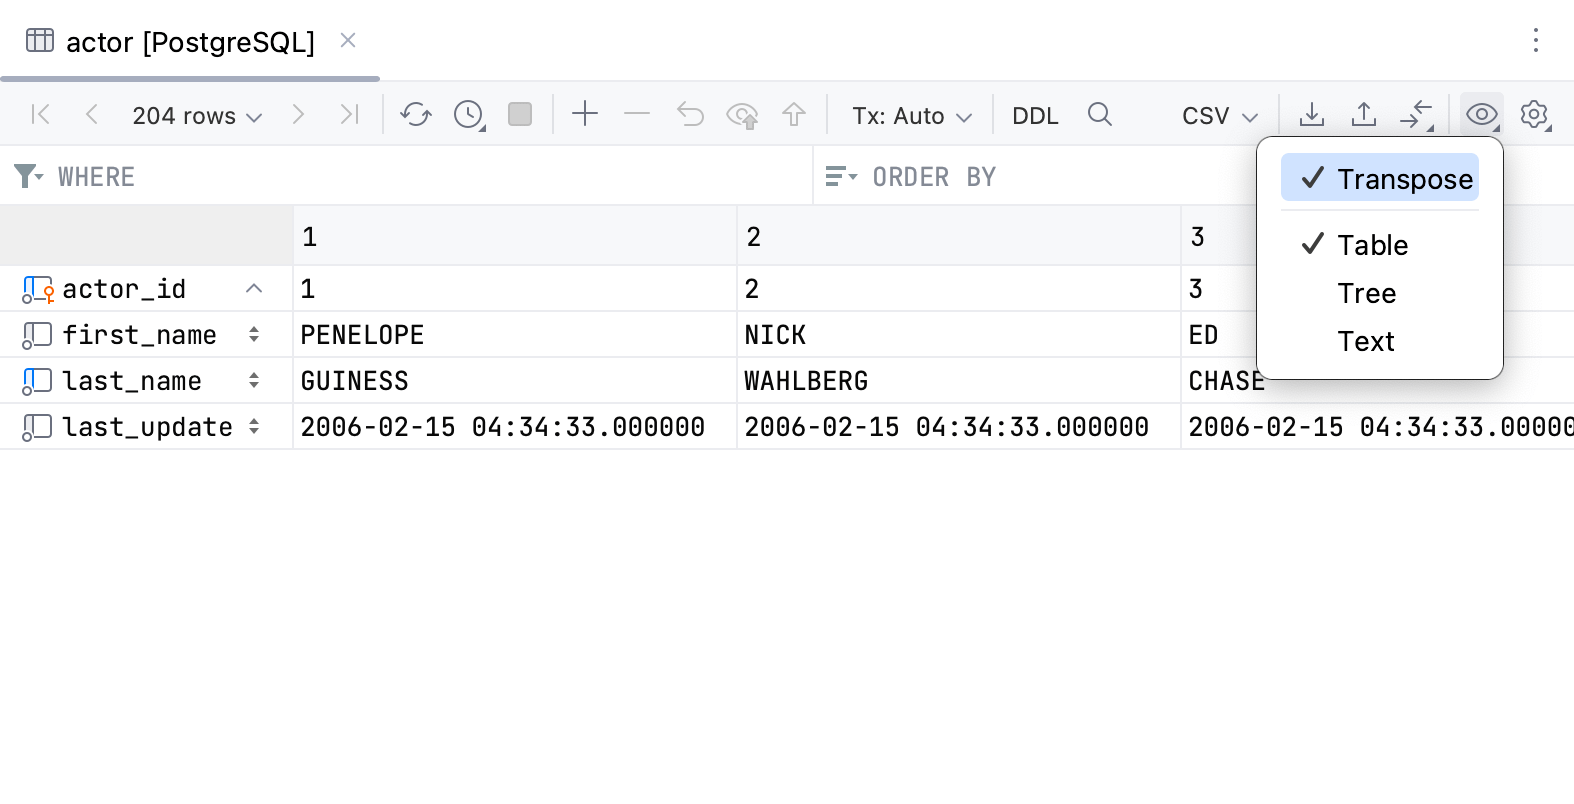
You can browse and edit data in three modes: Table, Tree, Text, and Transpose. To switch between these modes, click the View as button () and select the mode that you need.
Transpose: viewing mode in which rows and columns are interchanged. You can combine this checkbox with other viewing modes.
To make this mode a default for tables and views, open settings by pressing Ctrl+Alt+S and navigate to . . From the Automatically transpose tables list, select Always. When this option is enabled, query results are not transposed.

Table: the default viewing mode of table data. Data in a table is stored in a cell that is an intersection of a vertical column and horizontal row.

Tree: viewing mode in which data is displayed in the key-value table with the possibility to expand the key cell if it contains children nodes. Data from the expanded children node is distributed between key and value columns. You might consider using this mode to work with JSON and array data.

Text: viewing mode in which data is displayed as a text.

Transpose a table, a view, or a virtual view
You can rotate the table data from rows to columns and from columns to rows. In the transposed view, the rows and columns are interchanged. You can combine the transpose action with other viewing modes.
To transpose a table, a view, or a virtual view click the View as button (
) and select Transpose.

Reload data for the table view
You need to reload data for the table view if you want to synchronize the data that you see in the editor with the contents of the database. Or, when you want to apply the page size limit setting after its change.
Click the Reload Page button (
) on the toolbar.
Right-click the table and select Reload Page from the context menu.
Press Ctrl+F5.
View the query that generated the result set
To see the query that was used to generate the result table, click the Show Options Menu button (
) and select View Query. If necessary, you can select the query text and copy it to the clipboard by pressing Ctrl+C.
To close the pane where the query is shown, press Escape.

Preview DML
When you insert, delete, or modify data in a table editor, you can preview the query that PhpStorm uses to perform selected operations. To preview the query, click the Preview Pending Changes button (
) on the toolbar.
Explore values
Use editors and views to view, edit, and analyze values of table cells.
Value editor
Value editor is a separate editor where you can edit data that is stored in the cell. To open Value editor, in the cell context menu select Open in Value Editor.

To edit the value in the value editor, do the following:
To start a new line, press Enter.
To enter the value, press Ctrl+Enter.
To restore an initial value and quit the editing mode, press Escape.
To enable soft wrap in the editor by clicking the Toggle Soft-Wrap button
.
If you store one-line JSON in a cell, you can click the Toggle Formatting icon. This action formats one-line XML and JSON strings.
Preview images
You can preview images in the value editor. To do that, right-click the cell that contains an image and select View Image in the context menu.
Note that to leverage the performance issues, the default LOB size is limited to 1024 bytes. It means that only 1024 bytes are loaded to the table editor. To increase this size and view larger images, open settings by pressing Ctrl+Alt+S, navigate to , and change the value of the Maximum number of bytes loaded per value option.

Aggregate view
In PhpStorm, you can use data aggregator and data extractor scripts to get aggregated and extracted values.
In the Aggregate view, you can select values of multiple cells and get a single summary value. To open the Aggregate view, in the cell context menu select Show Aggregate View. The view displays the values calculated by aggregators.

Click the gear icon () on the toolbar of the Aggregates tab to view, enable, and disable aggregates. To access the bundled aggregator, select Go to Scripts Directory. The scripts are located in Scratches and Consoles | Extensions | Database Tools and SQL | data | aggregators. The directory will open in the Project tool window .
Also, you can create your own aggregate scripts. To add your own aggregator, place your script to the aggregators directory.

Single record view
You can view and edit the values of a certain record using a single record view in a side panel of the data editor.

To open the single record view, select a cell or a record and do one of the following:
Press Ctrl+Shift+Enter.
Click
Record View on the toolbar.
Right-click and select Show Record View.
For the single record view, there are two layouts: single-column layout and two-column layout. You can switch the layouts by clicking Settings in the upper-right corner of the panel and selecting the other layout.
Single-column layout | Two-column layout |
 |  |
Visualize data
You can use charts to visualize the database objects data and plot your query result sets in data editor. The available chart types are as follows: bar, pie, area, line, scatter, bubble, stock, area range, and histogram. You can also group your data.
Depending on what you are working with, the plot is displayed in split mode or instead of the table:
Database objects data and DSV files: split mode.
In-editor results and query results set in Services tool window: instead of the table.
Plot a chart
To visualize your data, click
Show Chart on the data editor toolbar.
Default chart type is selected automatically depending on the data types. To view the exact value, hover over it on the chart.

Configure a chart
You can view your data in either one of the supported chat types. Use the axes settings to plot the data you need with the available columns.
On the chart toolbar, click
Show Series Settings.
In the chart type selector, click the icon of the type that you want to plot.
For each axis, configure its settings:
Click Add Column and select the column that you want to plot.
Click
Modifier to modify the data display.

Plot multiple series
On the chart toolbar, click
Show Series Settings.
To plot one more series with the data from the same table, click Add new series and configure the new series.
To delete a series, click
Remove in the upper-right corner of the series settings pane.

Export charts
Click
Export to PNG on the chart toolbar to save the generated chart in the .png format.
Enter the filename and click Save.
Reference
Item | Description |
|---|---|
| Export chart in the .png format. |
| Opens the series settings pane with chart type selector and axes settings. |
Item | Description |
|---|---|
Chart types | |
Bar | |
Pie | |
Area | |
Line | |
Scatter | |
Bubble | |
Stock | |
AreaRange | |
Histogram | |
Controls | |
| (For multiple series plots.) Removes a series from the plot. |
X axis | Determines a column plotted on the X axis. Axis Modifier defines how the data is displayed:
|
Groups | Determines how the X axis values are grouped. |
Y axis | Determines a column plotted on the Y axis. Axis Modifier defines which Y axis values are displayed. |
View geographical data
Geographical data Viewer, or Geo Viewer, is a graphic viewer that you can use to explore geospatial data.
Currently, Geo Viewer works with data from your PostgreSQL database tables and tabular data files (CSV, XLSX, and other supported file formats). PhpStorm supports coordinates in the following formats: WKT, WKB, and PostGIS geometry 4326.
After opening the Geo Viewer, you can click table rows to navigate to the corresponding area on the map or click a pin on the map to navigate to the corresponding row.
View geo data from PostgreSQL table
In the Database tool window ( ) , double-click the table with geographical data.
Click
Show Options Menu on the toolbar of the data editor tab that opens and select Show Geo Viewer.
Read the notification about possible risks of enabling JCEF. If you accept the risk, click Enable JCEF.
In the Restart Required window, click Restart Now.
After the restart, press Ctrl+F5 or reopen the table with geographical data.
Click
Show Options Menu on the toolbar of the data editor tab and select Show Geo Viewer.
To detach the Geo Viewer tab from Services tool window, drag it from the tool window. To restore the layout, click Layout Settings in the upper-right corner of the viewer window and select Restore Default Layout.
View geo data from tabular data file
In the Project tool window ( ) , double-click the file with geographical data.
At the bottom of the editor tab that opens, click Data to view the file contents as table data.
Click
Show Options Menu on the toolbar of the editor tab and select Show Geo Viewer.
Recover PhpStorm after enabling JCEF
Navigate to the config directory.
- Syntax
%HOMEPATH%\.<product><version>\config\projects
- Example
C:\Users\JohnS\.PhpStorm2024.2\config\projects
- Syntax
~/Library/Application Support/<product><version>
- Example
~/Library/Application Support/PhpStorm2024.2
- Syntax
~/.<product><version>/config/plugins
- Example
~/.PhpStorm2024.2/config/plugins
In the options directory, open ide.general.xml in a text editor.
Remove the following line:
<entry key="ide.browser.jcef.enabled" value="true" />

