Find the Cause of a UI Freeze
In this tutorial, we will take a detailed look at the key profiling steps and introduce you to the dotTrace Viewer user interface. We will also profile a sample application and try to determine why its UI freezes, which is a very common profiling task.
Sample application
Our sample application is used to reverse lines in text files, for example, ABC => CBA. With the Select Files button, user chooses one or more text files to be processed. The Process Files button runs a separate BackgroundWorker thread which reverses lines in the files. Progress is displayed in the left-hand corner of the window. After processing is finished, the label reports All files were successfully processed.
The source code is available on github.

The application has a serious drawback. After starting file processing, users experience UI lags that last until processing is over.
Let's use timeline profiling to find out why these freezes happen!*
Running the profiler and getting a snapshot
Open the MassFileProcessing.sln solution in Visual Studio.
Run the profiler by choosing .
In Profiling type, select Timeline.
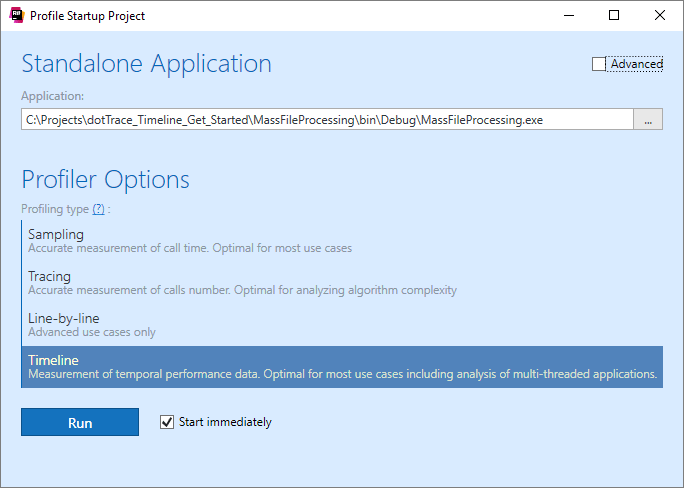
Click Run. dotTrace will run our application and display a special controller window used to control the profiling process.

Now, let's try to reproduce a performance issue in our app.
Click Select Files and choose five text files that come with the application in the Text Files folder.

Click Process Files to start file processing. As you can see, the application lags very badly. Actually, you are even unable to see the progress of file processing until it is finished and the All files were processed successfully message is shown.
Collect a timeline profiling snapshot by clicking Get Snapshot and Wait in the controller window. The snapshot will be opened in separate Performance Profiler tool window in Visual Studio.
Close the application. This will also close the controller window.
Analyzing a timeline profiling snapshot
Click Threads to open the Threads tool window. By default, it shows all application threads excluding unmanaged threads.* Note that all filter values you see are calculated for all currently visible threads. For further analysis, we are not interested in threads that perform no work. So, first let's get rid of them.
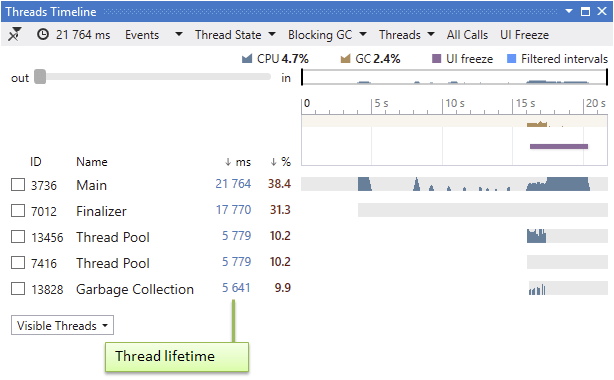
Look at the list of threads in the tool window. It contains the Main application thread, the Finalizer thread used by runtime for finalizing objects (does no work in our application), and Garbage Collection thread (used to perform background GC). The
BackgroundWorkerthread that processes files in our application was identified as Thread Pool (ID 13456) because background threads are created by the CLR Thread Pool. There's also one more Thread Pool (ID 7416) that does no work. This is probably some auxiliary CLR thread pool. Let's hide the Finalizer and Thread Pool (ID 7416) threads as irrelevant to our analysis.Select the Finalizer and Thread Pool (ID 7416) threads in the Threads tool window.
Right-click and select Hide Selected Threads.
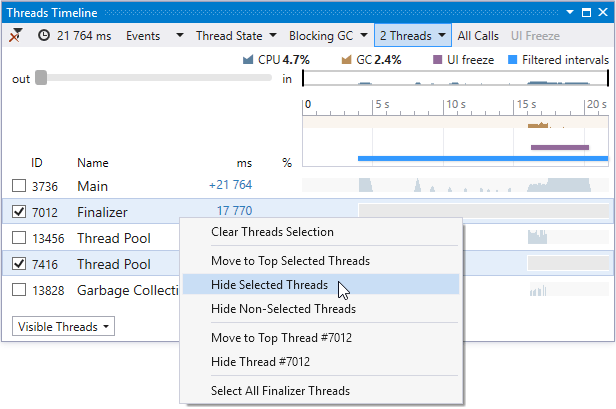
Look at the Threads window. The following filter is currently applied to the snapshot data: "Select lifetime intervals of all threads excepting hidden".
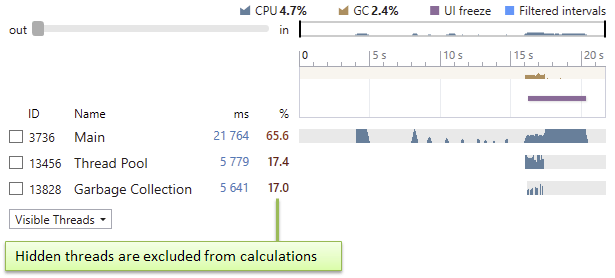
Note how the data in other filters were affected. For example, state times in Thread State are now calculated for all threads except the hidden ones. Hotspots and Call Tree have changed too, showing calls only from the filtered threads.
The current scale of the Threads diagram doesn't allow us to see the 13456 Thread Pool (our
BackgroundWorkerthread) in details. Let's zoom in so that it fits the entire diagram. To do this, use Mouse Wheel on the Threads diagram*. This automatically adds the filter by visible time range: 1489 ms. Note how this filter affects others: all values are recalculated for the visible time range. The following filter is now applied to the snapshot data: "Select all time intervals within the visible time range for all threads except hidden".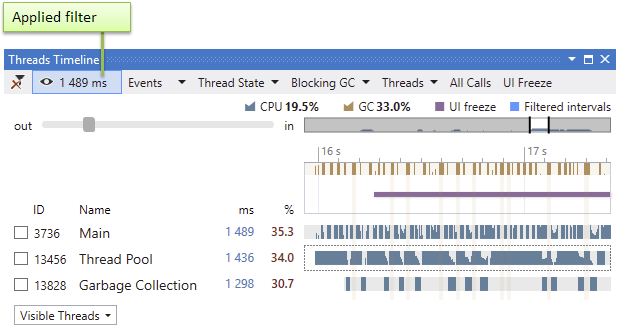
Take a look at the Threads diagram. What you see is how thread states changed over time. For example, our
BackgroundWorkerthread 13456 Thread Pool has started approximately at 16 s (after we clicked the Process Files button). Most of the time the thread was Running (rich blue intervals). Besides, there are intervals where the thread was in the Waiting state (pale blue intervals).
Look at the Process Overview diagram in the Threads tool window*. In addition to CPU utilization, it shows two event diagrams which may be very helpful for the performance analysis. The UI Freeze bar shows that the freeze started right after 13456 Thread Pool was created.
Blocking Garbage Collection GC was also intensively performed on this time interval. As blocking GC suspends all managed threads, it may be the potential cause of the UI freeze.
We must take a closer look at these events.
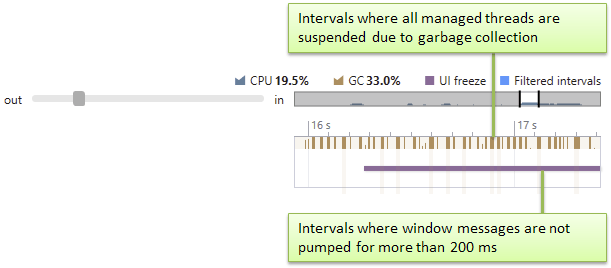
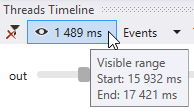
First, let's remove the visible time range filter as we no longer need it. To do this, click the filter in the top of the Threads tool window*. The diagram will zoom back out.
Now, let's investigate the UI freeze event more thoroughly. What are the main potential causes of such freezes? These are:
long or frequent blocking GCs;
blocking of the UI thread by some other thread (for example, due to lock contention);
and/or excessive computational work on the UI thread.
We will proceed to exclude these causes one by one until only the true culprit remains.
Select the UI freeze event by clicking on the corresponding bar in the process overview section of the Threads tool window. This will apply the filter by the UI freeze event. Note that this applies not only the filter by the freeze time range, but also the filter by the Main thread. The latter is done automatically, as the Main thread is the only one that processes the UI interaction in our application. Thus, the resulting filter now is "Select all time intervals on the Main thread where the UI freeze event took place".
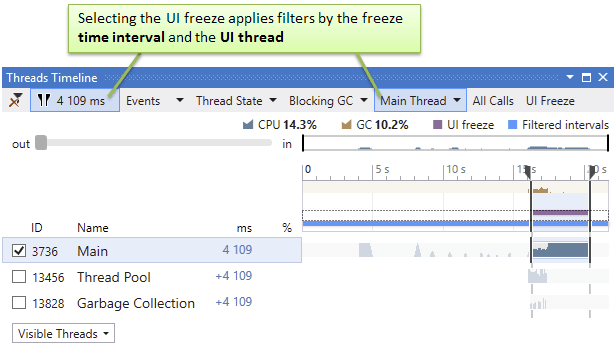
Now, to identify the true cause of this freeze, let's investigate other filter values. The first potential cause we should analyze is excessive blocking GCs.
Click Blocking GC to open the blocking GC filter and take a look at the values.
Taking into account the currently applied filters, it shows how long the Main thread was (Blocking GC value) and was not (Exclude Blocking GC value) blocked by GC during the freeze.
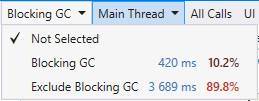
The Blocking GC time is quite high (420 ms, or 10.2% of the selected interval) and probably may have some impact on performance. Nevertheless, it could hardly be the cause of the 4-second freeze. Thus, we may exclude excessive garbage collection from our list of suspects.
Click the Exclude Blocking GC value. The resulting filter now is "Select all time intervals on the Main thread where the UI freeze event took place and no blocking GC is performed".
Let's investigate the potential causes "Blocking by some other thread" and "Excessive work on the Main thread."
Open and take a look at the values in Thread State. This filter shows total time spent by threads in a certain state. Taking into account the currently applied filters, it shows states of the Main thread during the freeze.
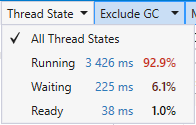
It appears that most of the freeze time (92.9%, or 3426 ms), the thread was doing some work as it was Running. The 225 ms value of the Waiting state is too small, which automatically excludes "Blocking by some other thread" from potential causes. Therefore, the cause of the freeze can only be computational work on the Main thread!
All we need to do now is find methods that were executed on the Main thread during the freeze. We can use the Hotspots and Call Tree filters for this.
Select Running in the Thread State filter. This will make the resulting filter "Select all time intervals where the Main thread was running when the UI freeze took place and no blocking GC was performed". The list of filters will look as follows:

Now, the filters Hotspots and Call Tree contain only methods executed during these time intervals.
In the Performance Profiler window, click Hotspots to open the corresponding filter. It shows a plain list of user methods sorted by their execution time. The execution time of a user method is calculated as the sum of the method's own time and own time of all system methods it calls (down to the next user method in the stack).

As you can see, there are only two methods with meaningful execution time:
App.MainandMainWindow.ProcessInProgress.Look at the Call Tree.

As you can see,
App.Mainspends most of the time in a number of system methods related to processing Windows messages.* This is typical behavior for any application that provides a graphical user interface. This indicates that the application waits for user input in a message loop. We can simply ignore these methods when analyzing the snapshot. To find out what method causes the freeze, we should look at the next user method in the stack, which turns out to beMainWindow.ProcessInProgress. Since we assumed that lags took place due to some computational work in this method, let's check its source code.In Call Tree, right-click the
ProcessInProgressmethod and select Navigate to Code in the context menu.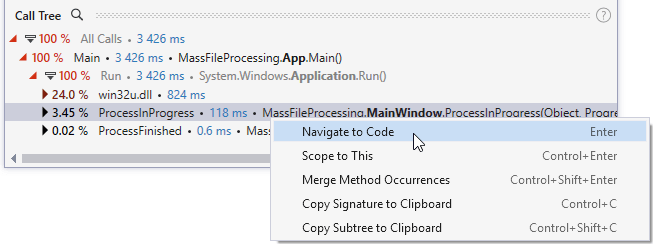
Look at the source code.
private void ProcessInProgress(object sender, ProgressChangedEventArgs e) { var upd = (ProgressUpdater) e.UserState; lblProgress.Content = $"File {upd.CurrentFileNmb} of {upd.TotalFiles}: {e.ProgressPercentage}%"; }It appears that this method is just an event handler that updates the progress of file processing operation in the progress label on the main window. These computations don't look complex, so why did the freezes occur? Apparently, this event handler is called so often that the main window cannot cope with updating the label. Let's check this out in our code.
Further code investigation* shows that this event handler is subscribed to the
ProgressChangedevent of the background worker. This event occurs when the worker calls theReportProgressmethod. In turn, it is called from theProcessFilesmethod of the background worker.... for (int j = 0; j < _lines.Length; j++) { var line = _lines[j]; var stringReverser = new StringReverser(line); _lines[j] = stringReverser.Reverse(); if (j % 5 == 0) { var p = ((float)(j + 1) / _lines.Length) * 100; Worker.ReportProgress((int) p, _updater); } } ...Here is the cause of our performance issues:
ReportProgressis called each time after 5 lines in a text file are processed. As lines are processed very quickly,ReportProgressis called too frequently for the system. Let's reduce this frequency, for instance, to one call per 1000 lines. Improve theifcondition in the code.... if (j % 1000 == 0) { float _p = ((float)(j + 1) / _lines.Length) * 100; Worker.ReportProgress((int) _p, _updater); } ...Rebuild the solution and perform profiling one more time as described in Running the Profiler and Getting a Snapshot.
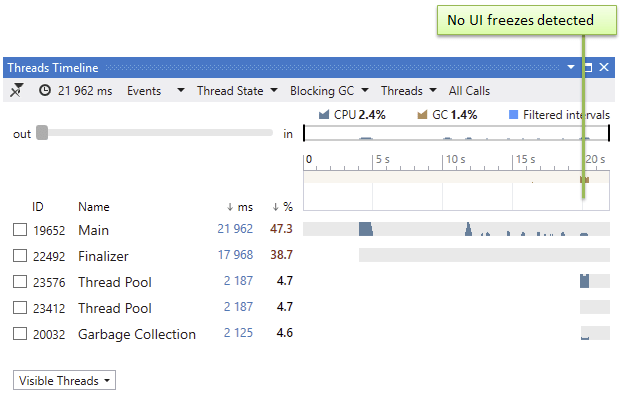
No lags any more! Timeline also doesn't detect any UI freezes during file processing.
Conclusion
Here are the main tutorial takeaways:
Unlike "classic" performance profiling, during timeline profiling dotTrace collects temporal call stack and thread state data.
To analyze the results of timeline profiling, you can use either a Performance Profiler tool window in Visual Studio or standalone dotTrace Viewer application.
Performance Profiler as well as dotTrace Viewer is a set of filters and diagrams that visualize the event timeline of your application and allow you to slice and dice the collected temporal data.
Each filter is dual-purpose: it both displays data and lets you set a specific condition.
Filters can be chained together.