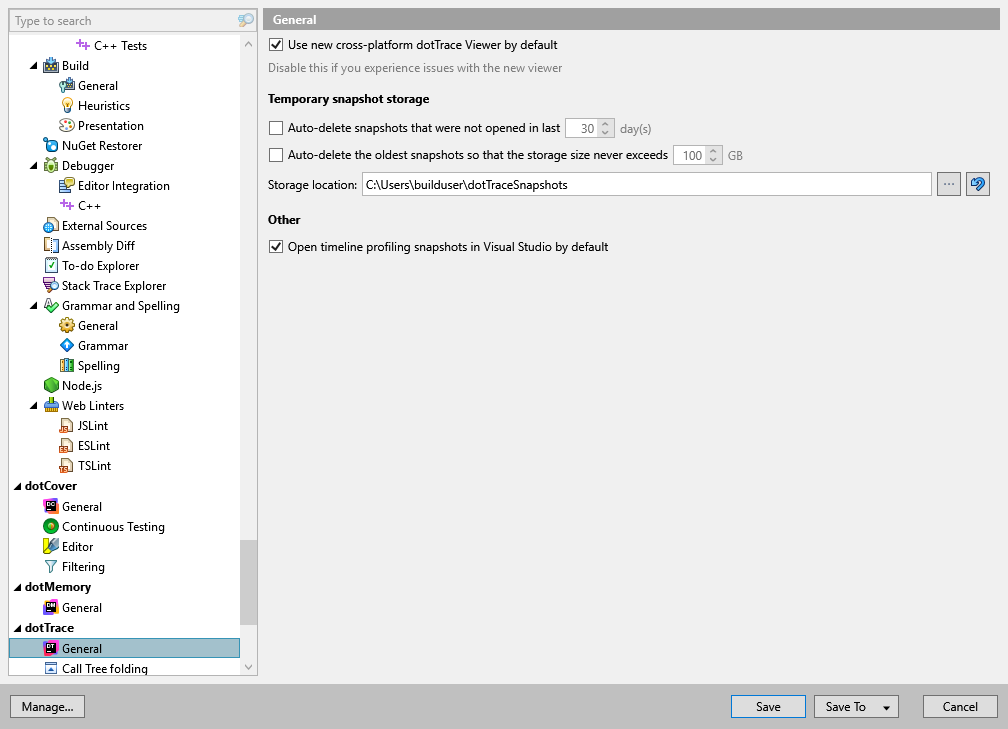
General

Open timeline profiling snapshots in Visual Studio by default | If enabled, double-click a particular snapshot in the Performance Profiler window will open the snapshot in the viewer integrated in Visual Studio. Otherwise, the snapshot will be opened in a standalone dotTrace viewer. |
11 February 2024