Back Traces
The Back Traces view allows you to see which functions called a particular function and how much time each call path contributed. Each path can be examined from the bottom up. In other words, Back Traces is the inverted Call Tree view.
This view is available only if you investigate a particular function separately. You may gain additional benefits from Back Traces if you open not a particular function instance but all function instances at once. In this case, Back Traces will show you all calls to the function from all call stacks in one place.
To open the Back Traces view
Open a particular function in a new tab.
Click the corresponding icon
 on the left panel.

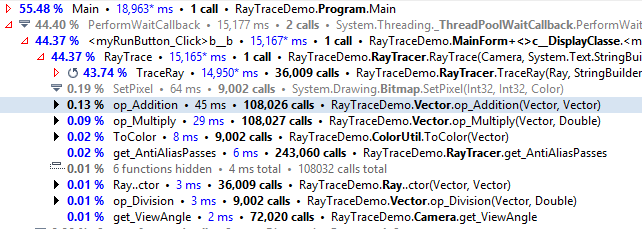
For better understanding the Back Traces view, consider the example. For instance, you are interested in op_Addition function call and want to follow the call path from the thread node to the current function call. You open the Call Tree view and navigate down the tree until you reach this function. Unfortunately, on your way down the tree, you have to observe other nodes that are actually useless for your research. In addition, you may miss other paths which are also important for optimization.
In order to avoid this, you can open all op_Addition instances on the Back Traces view. If the root function was called in different call stacks, dotTrace displays the contribution of the root function to time and number of calls in each call stack.

The percentage of time spent by the
op_Additionfunction in this call stack relative to root function time in the current tab.Short name of the called function.
Contribution of the
op_Additionfunction in this call stack to the root function time.Contribution of the
op_Additionfunction in this call stack to the number of root function calls.Full name of the called function.