Not Selected
Available for: timeline snapshots
As the name suggest, Not Selected means that no event is selected and the entire timeline is available for analysis. Use the Not Selected event in conjunction with other filters to analyze performance issues in your application.
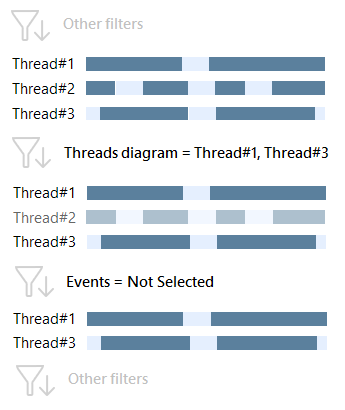
The value shown next to the Not Selected event is the total length of time intervals selected in Timeline Diagram. For example, your application has three threads: Thread#1, Thread#2, and Thread#3. Profiling lasted 50 ms. You want to analyze only Thread#1 and Thread#3. After you select them in Timeline Diagram, the Events filter will look like follows:
Not Selected 100 ms
...
The resulting selected time interval is the sum of the Thread#1 and Thread#3 length: 50 ms + 50 ms = 100 ms.
